Ethereum Classic is Climbing Up Sluggishly
At the tail end of 2019 and in the first six weeks of 2020, Ethereum Classic was what they call a hardcore gainer. During that time, the ETC had risen by a staggering 272%, thus turning this cryptocurrency into a magnet for traders who wanted to capitalize on incredible price growth.
But the fairytale has come to an abrupt end as the price capitulated to the level at $3.4 from which it began the journey to the upside, leaving those who were reluctant enough to go long at the top of the swing - from $11 to $13 - trapped in this market for an indefinite period of time or being forced to sell the coin, thus only expediting its downfall.

6-months ETC chart
On this chart that shows six months' worth of price action, we can clearly see how Ethereum Classic went from being dull to explosive and then back to dull, a condition in which it can linger for months before the next bull wave comes and lifts it up again. The present situation is exacerbated by the ongoing COVID-19 pandemic that pushed all markets - traditional and cryptocurrency - into a deep and apparently prolonged recession.
Barely passing the first barrier
Even though the entire world is in the lockdown, the cryptocurrency market lives and moves, offering enough money-making opportunities. If there's anything positive about the recent market collapse, it should be the fact that it allowed the price to re-confirm the support at $3.4 that holds since December 2018.

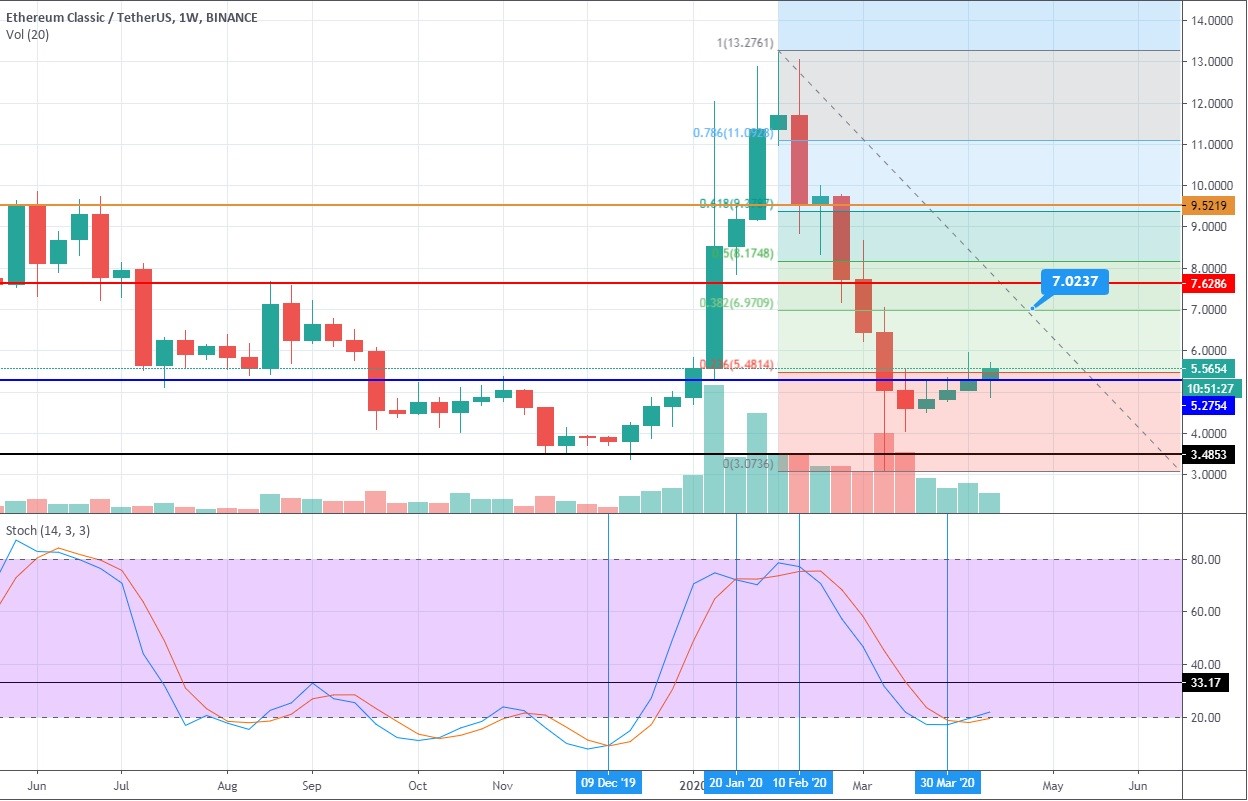
1-week ETC/USDT chart
Therefore, even if Ethereum Classic goes into another knockdown, delivered either by the fearful sellers, the second wave of coronavirus, or an economic crisis, it is likely to be halted again in that area, which could also serve as a precise point for entering a long position. The entire price action since the market crash took place within the boundaries between 0.3 and 0.28 Fibonacci levels, with the latter converging with the first resistance at $5.2, which ETC has barely managed to break on the back of the bullish Stochastic crossover near 20.
The trading practice shows that Stochastic provides reliable signals with regard to the price action of Ethereum Classic. As outlined in the chart above, each crossing of that oscillator was followed by significant price action either to the downside or to the upside. This leads to the conclusion that ETC is geared up for a bullish sprint to the 0.3 Fibonacci level, which lies directly at $7. Should the upward impulse be of extra vigor, traders could see an upper wick of the peaking green candle penetrating an embrasured resistance at $7.6, which would constitute the top of the upcoming bull rally.
Upon that, Ethereum Classic must perform a healthy retracement to $6.1 - $6.3 and initiate a prolonged phase of consolidation since the market would be significantly overheated at that point. Stochastic should stay on the tail of price action, finding resistance slightly above 33, as it is characteristic for this oscillator in this particular market to generate a single massive wave that is usually followed by two to three small ones.
Traders must also don't let the possibility of a bull trap slip their minds, as the upcoming upside move could be the climax of that market dummy, after which the price may well crash once again to the macro support at $3.4.
Author: Alex Paulson for Crypto-Rating.com
Top Cryptocurrencies with Price Predictions
| # | Crypto | Prediction | Accuracy | CVIX | Price | 24h | 7d | Market Cap | 7d price change | |
| 1 | Bitcoin predictions | 84.8% | 25 | $64 485.37 | 0.33% | 1.53% | $1 269 733 248 757 | |||
|---|---|---|---|---|---|---|---|---|---|---|
| 2 | Ethereum predictions | 72.8% | 47 | $3 156.53 | 0.53% | 2.97% | $385 248 931 720 | |||
| 3 | Tether predictions | 93.2% | 1 | $0.999827 | 0.02% | -0.07% | $110 444 368 558 | |||
| 4 | Binance Coin predictions | 88.4% | 20 | $614.21 | 1.01% | 11.23% | $90 649 755 653 | |||
| 5 | Solana predictions | 69.6% | 68 | $144.92 | -1.92% | 1.99% | $64 801 943 270 | |||
| 6 | USD Coin predictions | 94% | 2 | $1.000042 | -0.01% | 0% | $33 354 239 535 | |||
| 7 | XRP predictions | 68.4% | 64 | $0.525514 | -0.36% | 4.48% | $28 971 123 639 | |||
| 8 | Dogecoin predictions | 70.4% | 60 | $0.151394 | 0.03% | -0.69% | $21 806 112 367 | |||
| 9 | Toncoin predictions | 68.8% | 64 | $5.41 | -2.56% | -16.87% | $18 789 466 535 | |||
| 10 | Cardano predictions | 62.4% | 72 | $0.471080 | -0.81% | 2.82% | $16 786 416 060 | |||
| 11 | SHIBA INU predictions | 62.4% | 79 | $0.000026 | 0.19% | 12.90% | $15 155 447 928 | |||
| 12 | Avalanche predictions | 66% | 69 | $35.58 | -2.16% | 2.12% | $13 458 015 785 | |||
| 13 | TRON predictions | 83.6% | 21 | $0.117230 | 3.54% | 7.22% | $10 265 718 725 | |||
| 14 | Lido stETH predictions | 96% | 1 | $2 941.39 | -0.40% | -3.32% | $10 258 752 564 | |||
| 15 | Wrapped TRON predictions | 84.4% | 18 | $0.117092 | 3.24% | 7.19% | $10 253 646 591 |


