Crypto Volatility Index (CVIX): An Essential Risk Management Tool in Crypto Trading
Alex Paulson
Crypto and Forex professional trader, analyst, contributor.
The proper understanding of crowd sentiment and the ability to translate it to a successful cryptocurrency price prediction is the bread and butter of every successful trader. One might know the candlestick patterns by heart or have a decent trading strategy based on the indicators and moving averages, but without comprehending all those emotions that are bubbling underneath the price action, it’s impossible to understand the bigger picture. Fear and greed are what drives the market in all directions, and the more of these sentiments are corked inside such financial instruments as options, the larger would be the expected price swing that would bring about the increased volatility.
How crypto traders can benefit from using CVIX
And volatility is the name of the game in the cryptocurrency market as traders exploit the frequent and violent price swings for profit, though the volatile times could also entail significant losses if there’s no risk management being applied. One might be a marvelous chartist, but without the correct, and also timely, assessment of the anticipated market volatility, every crypto trading strategy and price analysis would be incomplete. That is why we at Crypto-Rating have developed our proprietary Cryptocurrency Volatility Index (CVIX) and made it an integral part of our price prediction model.

Above you see our price prediction panel that lists CVIX, which is currently flashing red. What does it mean, how to trade CVIX, and how one should perceive the current situation in the market through the lens of this index? In this article, we will explain in detail how the index works and how you should interpret its showings in order to become a better cryptocurrency trader.
It’s our firm conviction that CVIX is the perfect tool for gauging the crowd sentiment, especially if it starts showing the signs of bearishness, that nearly always precedes the downward price volatility of cryptocurrencies. The market goes where the crowd takes it, but CVIX allows us and our subscribers to have that edge of being able to anticipate the move before it occurs and to adjust the trading strategy accordingly, whether it’s setting a stop-loss, calculating the risk/reward ratio of a trade, or determining the targets for profit-taking.
The volatility of cryptocurrencies is one of their key characteristics, which makes trading them so lucrative and risky at the same time. And that brings us to the point that CVIX is an indispensable tool for risk management, without which literally every crypto trader is doomed for failure.
The origins of Crypto Volatility Index: from Cboe to cryptocurrencies
But before delving into all intricacies of CVIX usage, we would like to take you to the origins of this mighty useful index, which dates back to 1989, when two prominent economists, Dan Galai and Menachem Brenner, proposed the Sigma Index for gauging the market volatility that became the forefather of CVIX. The Chicago Board Options Exchange (CBOE, now rebranded to Cboe Global Markets) took upon this idea and used the help of stock market volatility experts to develop the proprietary tool for volatility assessment and risk management - the Market Volatility Index or VIX.
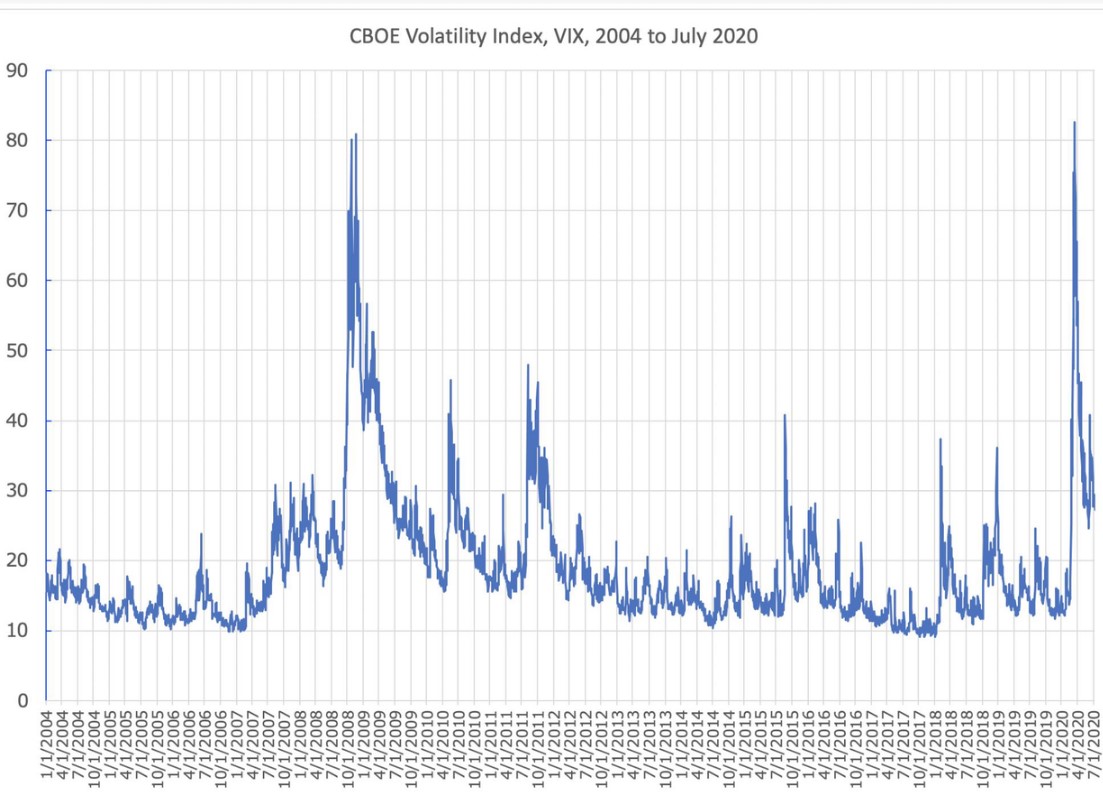
Here is how the original volatility index looks when presented as a chart. Notice that the biggest spikes had occurred in 2008, during the last major economic crisis that was instigated by the fall of Lehman Brothers, and March of this year, right around the time when the World Health Organization (WHO) declared the outbreak of COVID-19 to be a global pandemic that led to a notorious flash crash. The index rose every time there was an increased fear around the market, that’s why it’s also called the Fear Gauge, which had ultimately led to considerable price drops, and extreme ones at times of deep crises. That is the primary reason for keeping a close eye at all times on CVIX when trading cryptocurrencies, and VIX in case you are trading stocks, because it’s by far the best way to recognize the upcoming volatility of a cryptocurrency and adjust both trading and risk management strategies accordingly.
At the foundation of VIX lies the price inputs of the S&P 500 index options. FYI, S&P 500 is the stock market index that reflects the performance of the 500 biggest US corporations, whereas the index option is a popular financial derivative that allows traders to buy or sell the index on a predetermined date and at a strike price. The traders use the call (buy) or put (sell) options to speculate in the direction of the market.
The idea behind options is quite simple: the trader is literally betting on the price to go up or down to a certain level, where the strike price is set. For instance, Bitcoin is currently being traded at around $19,000 per coin. Let’s say that a trader buys a put option on BTC with the strike price being set at $16,000. It implies that the trader fears that over the course of the next month, Bitcoin would drop by 15% and uses options to hedge against potential losses. VIX measures the anticipated 30-day volatility, also known as implied volatility (IV), on the basis of statistical calculations, using a deviation method when establishing the historical volatility (HV), as well as the option pricing methods.
The Cboe Volatility Index has proven so effective in determining the crowd sentiment and foreseeing the period of increased volatility that it migrated to the cryptocurrency market that is known for its violent price swings. We gave it a few tweaks, made the necessary adjustments and improvements to obtain the Cryptocurrency Volatility Index (CVIX) that derives statistical data from the top Bitcoin and Ethereum futures and options trading platforms, such as Binance, Deribit, LedgerX, or Quedex.
Moreover, we add weight to the CVIX index by making AI take into account the changes in market capitalization of a given cryptocurrency along with the history of its price action throughout the entire existence of the coin. This way, we are able to combine both statistical and option pricing methods to achieve the best results in measuring the expected cryptocurrency volatility and drawing price predictions for 100 most popular cryptocurrencies.
What CVIX tells you
After we got you acquainted with the story behind CVIX, its overall concept, and calculation methods, it’s time to get to the practical side of things and delve more into how to trade CVIX for your own benefit.
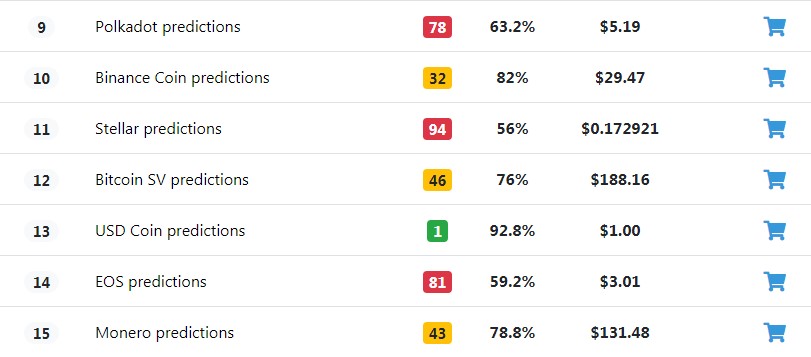
On this screenshot of our cryptocurrency price prediction section, you see the red, yellow, and green boxes, which serve as the visual representation of the showings of our proprietary Cryptocurrency Volatility Index.
Here we see that Stellar (XLM) is flashing red, which means that the expectations of very high volatility in the next 30 days are running high, with the calculated price prediction accuracy being at 94%. The red CVIX demonstrates that the overwhelming majority of cryptocurrency options traders are fearful of significant price fluctuations, mostly to the downside. Now, let’s see how the reading of CVIX can be applied to chart reading and provide an extra confirmation for the trade.
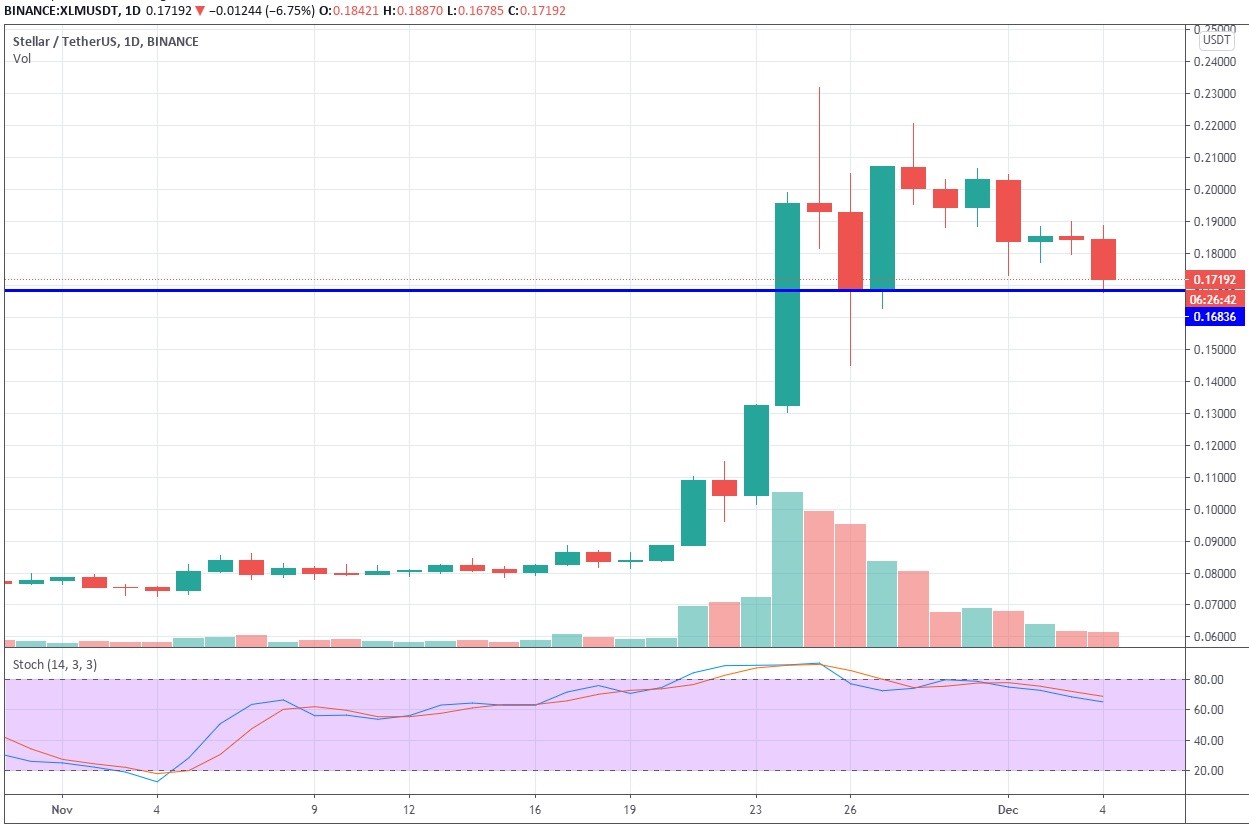
1-day XLM/USDT chart
It’s obvious that Stellar has been immensely volatile these last couple of weeks, having performed an awe-inspiring 220% bull run that had sent its volatility reading through the roof. But after some heavy rejections in the $0.2 - $0.21 price area, the bears have gained control and began forcing XLM into correction. Should the price break the support at $0.17 to the downside on a rising bearish volume, a nosedive to $0.11 would look almost imminent. In that particular case, the CVIX readings provide a strong confirmation of the looming price drop, along with the predominantly bearish trading volume and the sloping Stochastic, thus increasing the success probability of a short trade.
But remember, red CVIX doesn’t always mean that the price is going to depreciate. Keep in mind that volatility can work both ways, so the red-hot CVIX doesn’t always imply that the price is going to crash, so refrain from perceiving it solely as the provider of sell signals. Always make sure to check with the charts in order to have an understanding of where the market is heading at the moment, and set up the trades accordingly.
How to trade red CVIX:
- Check with the charts in order to have an understanding of price behavior: whether it’s trending to the upside or to the downside, or consolidating;
- Set up support and resistance levels, upon breaking which, the price could have a strong impulse to either side;
- Pull your stop-losses closer to the established support, but don’t place them too tightly in order to avoid being stopped out;
- Consider moving the profit targets further away since red CVIX signals about violent price swings that can be capitalized on, if anticipated properly.
Now, let’s move on to Monero (XMR), which has CVIX colored yellow, meaning that the market participants aren’t overly fearful of the price traveling southward at top speed. Instead, they expect relatively moderate price swings that, however, won’t pose any serious threat to the established trend structure. Yellow CVIX could also be indicative of price being locked in a wide range, where the price action still has some room for an impulsive growth or fall, though it would eventually encounter a strong support or resistance level.
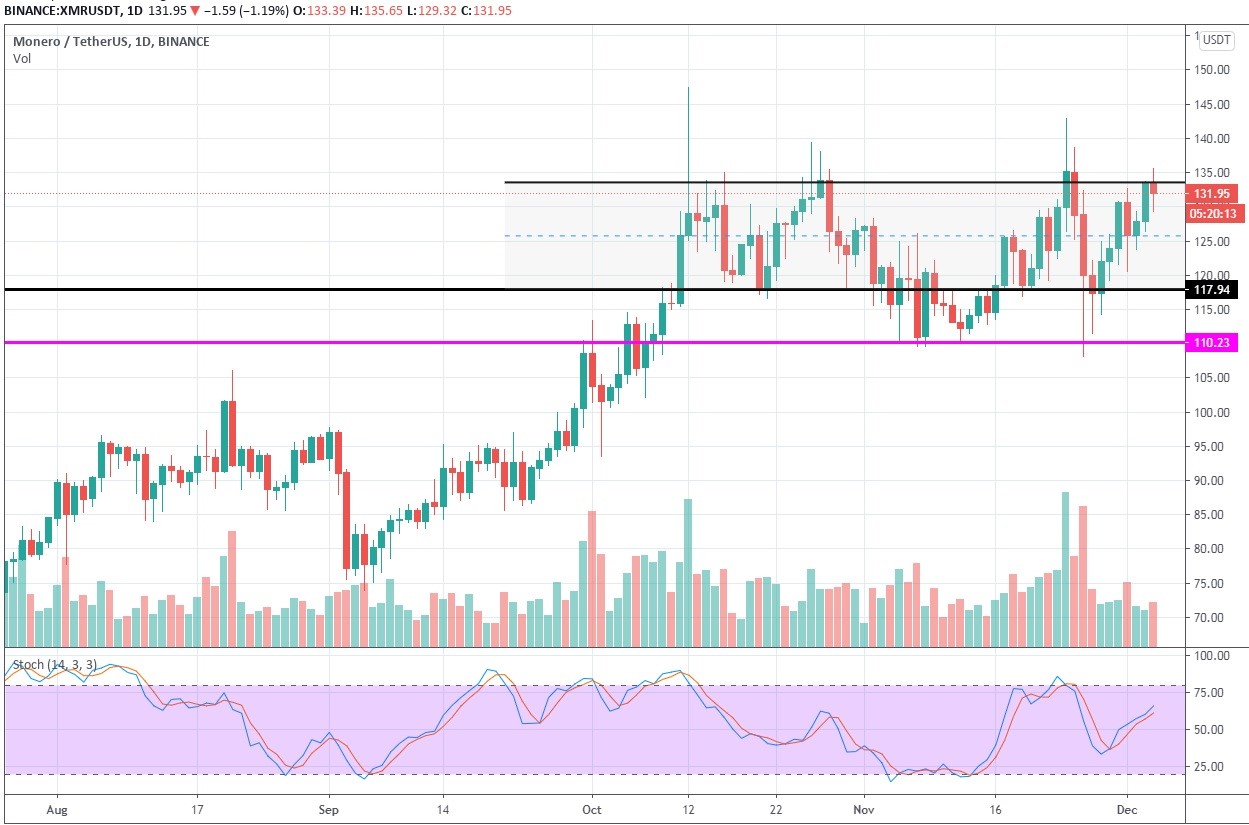
1-day XMR/USDT chart
The chart above shows exactly that - XMR has found itself gridlocked in a relatively wide range ($117 - $133), which it has briefly broken to the upside or to the downside as large market players, and even some exchanges, are seeking to stop-out the majority of retail traders. Regardless of these little tricks, the yellow CVIX hints that this particular market is characterized by reasonable volatility and better predictability, compared to more volatile markets. Here on the XMR market, the price action demonstrates 12% to 18% swings to both sides, while still respecting the boundaries of the horizontal channel, thus providing ample opportunities for profit-making with an increased probability of successful outcome of trades.
How to trade the yellow CVIX:
- Determine support and resistance levels that will form the framework of a trading channel (horizontal, rising, or falling);
- Since CVIX is yellow, build your trading strategy on the notion of the implied volatility of no less than 5% to 7% on a full price swing;
- Pull the stop-losses away from the zones where other market participants presumably have their stop-losses - they are usually located in close proximity to the channel boundaries;
- Always keep your eyes on breakout signals.
Now, let’s move on to the green CVIX, which is a bit of a rarity among cryptocurrencies, excluding stablecoins, the very name of which implies that one shouldn’t expect significant price fluctuations in this market for the next 30 days. The green usually colors the index when the trading range is extremely tight, which heightens the success probability but also greatly diminishes the earning potential for traders.
How to trade the green CVIX
- Increase your trading position substantially if you intend to make decent money;
- Be mindful of trading fees that could eat up a large chunk of profits if you are trading in a very tight range.
Basically, coins with green CVIX are more suitable for holders and investors who aren’t seeking immediate profits and prefer relative stability to roller coaster rides.
CVIX and risk management
All of the tips provided above should be considered when devising a risk management strategy for trading cryptocurrencies, which are rightfully considered to be the riskier asset class. Proper risk management is crucial for successful trading, and the CVIX reading is indispensable for planning trades ahead.
Firstly, as we have reiterated many times here, the Cryptocurrency Volatility Index is the perfect instrument for gauging the mood of the market: the higher the CVIX, the more fearful are the participants. For instance, the red CVIX should tell the trader that it’s time to start thinking about downside protection.
The change in CVIX should also force traders to adjust the position size according to the current market conditions: decrease if CVIX is red or gradually increase when it's yellow, and the trader is certain of his strategy.
Stop-losses are crucial for risk management in crypto, and CVIX offers probably the best indication of when the trader should bring the stop-losses and take-profits closer or further away from the area of price action. Thanks to knowing the implied volatility, traders are able to calculate the expected return more accurately and with greater consideration for the market sentiment.
All in all, CVIX is a very versatile index that has proven useful in all areas of trading.
They say that trend is your friend, but in that case, volatility is your wingman that will help you navigate through the stormy waters of the cryptocurrency market.
Author: Alex Paulson for Crypto-Rating.com
Top Cryptocurrencies with Price Predictions
| # | Crypto | Prediction | Accuracy | CVIX | Price | 24h | 7d | Market Cap | 7d price change | |
| 1 | Bitcoin predictions | 86% | 27 | $62 829.69 | -2.18% | -1.40% | $1 237 172 031 531 | |||
|---|---|---|---|---|---|---|---|---|---|---|
| 2 | Ethereum predictions | 77.2% | 43 | $3 123.05 | -0.18% | 2.36% | $381 171 644 410 | |||
| 3 | Tether predictions | 95.6% | 1 | $0.999349 | -0.04% | -0.16% | $110 489 885 538 | |||
| 4 | Binance Coin predictions | 84% | 21 | $587.66 | -2.55% | 5.59% | $86 732 091 685 | |||
| 5 | Solana predictions | 66.8% | 70 | $136.00 | -4.94% | -4.16% | $60 813 251 214 | |||
| 6 | USD Coin predictions | 90.8% | 2 | $1.000053 | 0.01% | -0.02% | $33 478 844 310 | |||
| 7 | XRP predictions | 66% | 70 | $0.513420 | -1.78% | -1.41% | $28 359 247 255 | |||
| 8 | Dogecoin predictions | 67.2% | 66 | $0.144107 | -3.82% | -5.47% | $20 759 471 643 | |||
| 9 | Toncoin predictions | 70.8% | 65 | $5.21 | -3.56% | -15.56% | $18 103 248 217 | |||
| 10 | Cardano predictions | 60.4% | 80 | $0.452803 | -3.34% | -5.31% | $16 135 653 112 | |||
| 11 | SHIBA INU predictions | 64% | 82 | $0.000024 | -5.18% | 4.67% | $14 287 280 249 | |||
| 12 | Avalanche predictions | 63.2% | 78 | $33.90 | -3.70% | -3.45% | $12 819 991 022 | |||
| 13 | TRON predictions | 83.6% | 21 | $0.119972 | 1.28% | 9.47% | $10 505 032 285 | |||
| 14 | Wrapped TRON predictions | 87.6% | 18 | $0.119970 | 1.66% | 9.61% | $10 504 849 782 | |||
| 15 | Lido stETH predictions | 94.8% | 1 | $2 941.39 | -0.40% | -3.32% | $10 258 752 564 |


