


Stellar trying to get out of the bear claws
There is no denying the fact that Stellar (XLM) belongs to a cohort of the finest cryptocurrencies in terms of their fundamental value, especially in the area of cross-border financial transactions and the issuance of new crypto tokens. Some argue that Stellar is superior to Bitcoin and Ethereum with regard to transaction speed, fees, scalability (which is especially relevant to Ethereum, though the Istanbul hard fork is said to have eased the scalability problem), and the effectiveness of smart contracts.
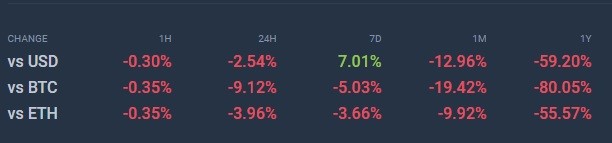
However, the price of XLM, and any other cryptocurrency, for that matter, don’t depend solely on its fundamentals, or we would have absolutely different top coin rankings. Whereas blockchain and dApp developers may adore Stellar, traders, and especially holders, weren’t going into raptures over XLM’s performance during the previous year. The coin ended the twelve-month run on a negative note and showed nothing but losses on a yearly chart against the USD and the two dominant cryptocurrencies. This resulted in Stellar been pushed from the top 10 by Monero, with Tron stepping on its toes.
To end the quick recap of Stellar’s previous activity, take a look at the 1-year chart which clearly shows that XLM had eagerly participated in the short-term bull run that allowed the coin to reach the 2019 high of $0.141, which is still 84.8% lower than its all-time high of $0.93.
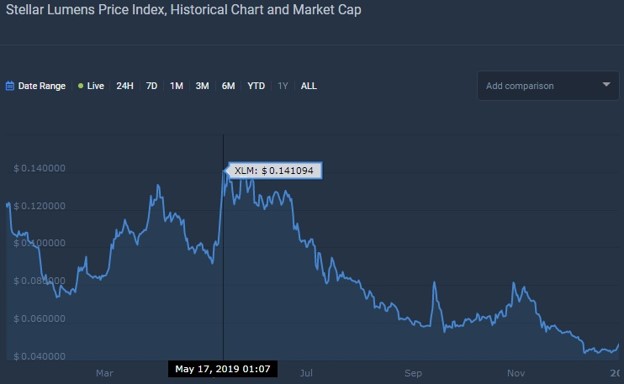
The bears got hold of XLM slightly earlier than they did with regard to the rest of the crypto market as Lumens entered a textbook downtrend in mid-June, whereas the majority of other top cryptocurrencies remained in the green for around months and a half more. The market capitalization has been following the price action to the letter, having reduced from $2,6 billion at the peak of the 2019 uptrend, to the current $984 million.

All in all, Stellar didn’t manage to reverse the downtrend, which lingers since its golden days in January 2018. The current price, which appears to be testing the resistance at $0.05, has fallen down to the level of November 2017, the time that preceded its most powerful bull run as of yet. The question now is, will XLM bottom out in the next couple of weeks and finally start showing gains or will it continue the downslide.
Before getting down to charts and technical indicators, let’s see how Stellar does in other areas, which also might give a hint at its inclinations. The number of active addresses has been on the decline since May 2019 with periodic improvements.

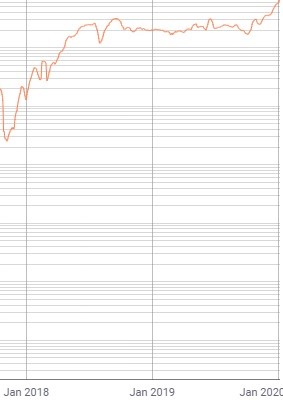
There is currently a rapid almost four-fold increase in the number of transactions using XLM since the beginning of November 2019, which is undoubtedly a positive sign that indicates the usefulness, thus the popularity, of this cryptocurrency.
However, this also signifies the ambiguity in Stellar’s behavior, which is also depicted on the charts. On the 1-day chart in the XLM/USDT pair, we see that XLM had consolidated since December 17, 2019, until January 5, and then put up a big green candle, which tested the resistance at $0.05.
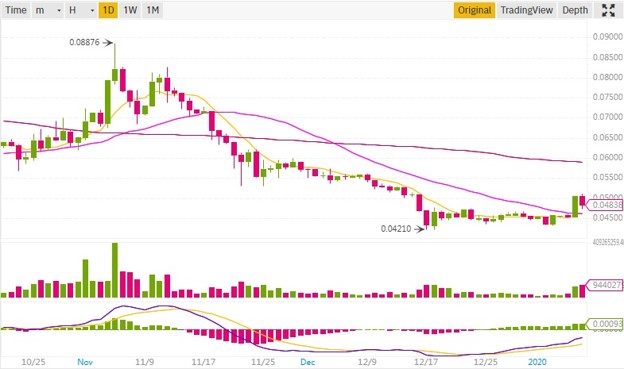
This period was also characterized by a visible boost in trading volume, though it is evident that the bears could regain the initiative and push the price back to $0.042. On the XLM/BTC chart, things look quite grim for the 11th cryptocurrency as there has been a considerable drop, which may continue, judging from the RSI showings. It might be a good pair to trade right now, given that you are willing to wait for the Stellar’s trend reversal.

Back to the XLM/USDT pair, the RSI on the 12-hour chart shows that the coin had entered the overbought area and now seeks balance. The MACD oscillator also hints that after testing the new resistance, XLM will roll back to the previous support level.

To summarize, Stellar is likely to continue the consolidation for the next couple of weeks, if it fails to flip the $0.05 resistance into support. However, with no clear signs of a trend reversal, it might be better to monitor XLM without entering long positions.
Author: Alex Paulson for Crypto-Rating.com


Top Cryptocurrencies with Price Predictions
| # | Crypto | Prediction | Accuracy | CVIX | Price | 24h | 7d | Market Cap | 7d price change | |
| 1 | Bitcoin predictions | 80.8% | 27 | $63 173.85 | -2.08% | -1.14% | $1 243 952 961 972 | |||
|---|---|---|---|---|---|---|---|---|---|---|
| 2 | Ethereum predictions | 76.8% | 43 | $3 147.56 | 0.05% | 2.76% | $384 163 813 358 | |||
| 3 | Tether predictions | 94% | 1 | $0.999391 | -0.04% | -0.08% | $110 494 576 597 | |||
| 4 | Binance Coin predictions | 86% | 20 | $592.69 | -1.61% | 6.04% | $87 473 429 177 | |||
| 5 | Solana predictions | 65.6% | 70 | $138.91 | -3.64% | -2.57% | $62 115 312 462 | |||
| 6 | USD Coin predictions | 94.4% | 2 | $1.000057 | 0.01% | 0% | $33 483 745 699 | |||
| 7 | XRP predictions | 65.6% | 70 | $0.516995 | -1.26% | -0.01% | $28 556 682 921 | |||
| 8 | Dogecoin predictions | 69.2% | 66 | $0.146527 | -2.33% | -4.38% | $21 108 381 756 | |||
| 9 | Toncoin predictions | 67.2% | 65 | $5.29 | -2.21% | -14.58% | $18 375 772 914 | |||
| 10 | Cardano predictions | 60.4% | 80 | $0.460492 | -2.34% | -4.33% | $16 410 183 641 | |||
| 11 | SHIBA INU predictions | 58.4% | 82 | $0.000025 | -3.13% | 6.14% | $14 513 666 092 | |||
| 12 | Avalanche predictions | 65.2% | 78 | $34.29 | -3.59% | -2.80% | $12 967 710 938 | |||
| 13 | TRON predictions | 84.8% | 21 | $0.120488 | 1.07% | 9.88% | $10 550 046 018 | |||
| 14 | Wrapped TRON predictions | 87.6% | 18 | $0.120160 | 1.17% | 9.38% | $10 521 331 030 | |||
| 15 | Lido stETH predictions | 94% | 1 | $2 941.39 | -0.40% | -3.32% | $10 258 752 564 |