


NEO: Cup & Handle Turned Bearish Spike Pattern
In our previous price prediction article dedicated to NEO, we entertained the possibility of finalization of the cup and handle bullish formation that must result in a substantial price spike. As a result, the price action had played out this scenario to the letter by performing a massive move to the upside right after the handle had been formed - a 70% gain in a couple of weeks, to be precise.
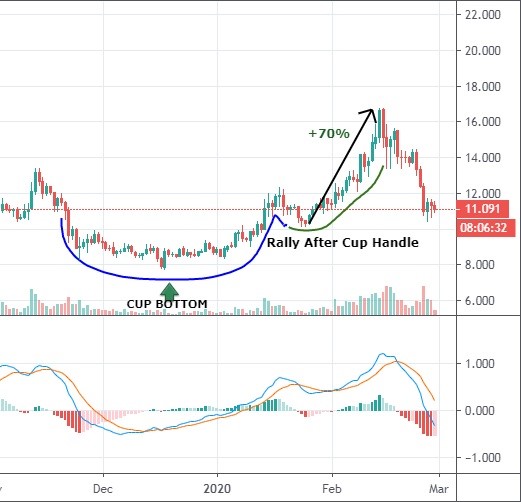
1-day NEO/USDT chart
Right now, however, we are having a diametrically different situation as the market is tanking insanely due to various reasons, among which many indicate the increasing correlation with traditional markets - S&P 500, for instance, - which are also going through a downfall, the biggest one since the financial crisis of 2008. The global scare of the coronavirus outbreak has also contributed to the situation that we are witnessing on the charts, with this factor being especially relevant to the Chinese blockchain projects like NEO.
How the price of NEO reacted to the market fever
It’s understandable that NEO couldn’t have been left unaffected by the global occurrences on the markets, and the price of the 20th cryptocurrency reacted accordingly. In the period of the last seven days, the value of NEO had decreased by 19.28%, which is considered the biggest pullback since last August, when the minor uptrend had collapsed. Nevertheless, NEO still retains the positive yearly return on investment (24%) and a more than respectable all-time ROI of 6000%. Therefore, the ongoing correction, which many have already labeled as a downtrend, shouldn’t cause too much concern among long-term holders since the coin remains profitable and is likely to rebound once the market shows signs of recovery. But traders who have only recently added this coin to their portfolio, and don’t intend to hold it for a prolonged period of time, should be preoccupied with elaborating the exit strategies because there is a probability of NEO returning to the price levels recorded in early January, thus going back to square one in terms of gains.
The sinking NEO
On the daily chart, we can see that after the initial drop to the interim support at $14, where the price had dwelled for a while, had been followed by a textbook bearish pattern called three black crows, which took the price down to $11 at the close. And even though NEO has been consolidating for the past three days, everything points to the continuation of the downward slide.

1-day NEO/USDT chart
To be more precise, MACD is currently considerably below the zero-level, with both lines going further away from each other, which hints that the pressure from the bears will persist. Most likely, the sellers are aiming to push the price to the 200-period moving average, which currently runs parallel to the $10 level. That MA should act as strong support, from which the move to the upside - the previous support at $14 that would now act as resistance - appears to be feasible. However, if the price falls below the 200 MA, then it is most likely to find the bottom at the pre-2020 levels at $7.7 or even $6.6 - traders who had obtained NEO in early January should be prepared for this scenario.
Author: Alex Paulson for Crypto-Rating.com


Top Cryptocurrencies with Price Predictions
| # | Crypto | Prediction | Accuracy | CVIX | Price | 24h | 7d | Market Cap | 7d price change | |
| 1 | Bitcoin predictions | 74.4% | 54 | $68 221.63 | 1.27% | 2.38% | $1 346 132 518 889 | |||
|---|---|---|---|---|---|---|---|---|---|---|
| 2 | Ethereum predictions | 76.8% | 47 | $3 277.70 | 0.62% | -6.01% | $394 072 124 681 | |||
| 3 | Tether predictions | 95.6% | 1 | $1.000294 | 0.04% | -0.03% | $114 362 869 613 | |||
| 4 | Solana predictions | 64.4% | 70 | $186.46 | 3.76% | 10.05% | $86 651 629 563 | |||
| 5 | Binance Coin predictions | 77.6% | 42 | $588.60 | 1.71% | -0.56% | $85 893 706 101 | |||
| 6 | USD Coin predictions | 90.8% | 1 | $1.000218 | 0.01% | 0.02% | $34 165 068 764 | |||
| 7 | XRP predictions | 62.4% | 86 | $0.601322 | 0.08% | 1.60% | $33 650 519 304 | |||
| 8 | Dogecoin predictions | 72% | 55 | $0.135778 | 4.40% | 6.72% | $19 726 589 838 | |||
| 9 | Toncoin predictions | 83.6% | 31 | $6.74 | -0.27% | -8.09% | $16 954 582 289 | |||
| 10 | Cardano predictions | 72.4% | 49 | $0.417851 | 0.74% | -4.48% | $15 002 527 040 | |||
| 11 | TRON predictions | 86.4% | 18 | $0.137290 | 0.44% | 2.02% | $11 952 578 512 | |||
| 12 | Avalanche predictions | 77.6% | 38 | $28.70 | 1.64% | 1.95% | $11 330 467 420 | |||
| 13 | Lido stETH predictions | 93.2% | 1 | $2 941.39 | -0.40% | -3.32% | $10 258 752 564 | |||
| 14 | SHIBA INU predictions | 84.4% | 30 | $0.000017 | 2.35% | -3.05% | $10 173 129 198 | |||
| 15 | Wrapped TRON predictions | 90.8% | 1 | $0.116354 | -0.46% | 0.23% | $10 171 995 609 |