NEO: The misleading rally in January
NEO belongs to a cohort of cryptocurrencies that began the year on a positive note. Not only did the coin made close to 30% in a matter of a week, which had been much higher a few days ago, when the market was at the peak of the raging rally. This surge was, of course, incentivized by the overall bullish sentiment on the market, but a part of it was born out of the improvements in the area of fundamentals, which the NEO organization announced at the beginning of last week.
A sizable investment in the infrastructure
On January 14, the team behind NEO issued a press release through which they informed the interested parties about a presumably substantial investment of $100 million in Switcheo, NEO’s proprietary decentralized exchange that was launched in 2018. The platform didn’t get much traction right away and was even considered a backwater one due to the lack of tradable cryptocurrency pair - an issue that should be addressed after the said injection of funds. This problem should be resolved by affording traders the opportunity to pay fees in NEO gas tokens instead of the SWTH ones, which have proven to be unpopular among cryptocurrency users.
Moreover, the financial supplementation was made by virtue of NEO EcoBoost, the project’s own platform for funding promising blockchain-enabled solutions. Therefore, NEO began oiling up its ecosystem from the very start of the year, thus giving an additional boost to its eponymous cryptocurrency.
The misleading rally
After the euphoria from a somewhat sudden bull rally has begun to wear off, we get a chance to analyze the market with a bit cooler head and see the bigger picture that unfolds on the charts.

1-day NEO/USDT chart
The daily NEO/USDT chart clearly shows the ongoing rally has so far didn’t even bring the price up to the resistance area at $13.3, which must prove to be immensely stubborn, judging from the history of NEO’s price action in the period from March 2019 till the present date. This brings us to the question of whether the last charge made by the bulls would turn out to be only a bright episode of the lingering correction that at the end of the previous summer?

NEO all-time chart
Things get even less optimistic when we zoom out on the chart to see the entire price history of NEO. Obviously, there is no point in arguing the fact that the talks of the commencing bull market are exaggerated, at least for NEO. As we see here, the rally could be nothing but a part of a persisting consolidation. Therefore, there’s no point in placing hopes on the trend reversal and going long on NEO at that particular moment. On the smaller time frames, though, the situation looks more promising.
How NEO could perform in the immediate future
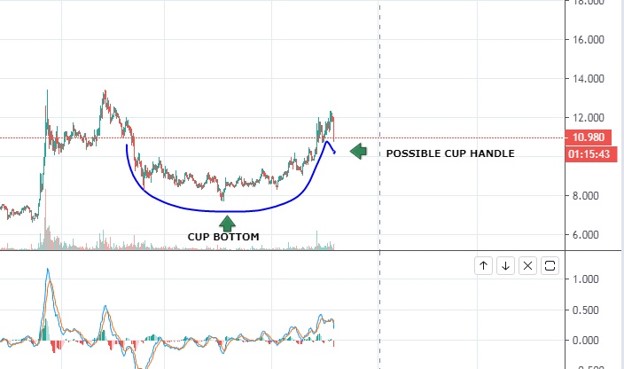
Moving to the 4-hour time frame, it becomes evident that the price is currently finalizing the formation of a cup with a handle pattern that is generally considered as a strong indicator of bullish sentiment.

4-hour NEO/USDT chart
In order to form the handle, the price of NEO must briefly drop below $10 and then bounce back to around $11.6 and continue to move upward. Should that scenario play out, it would afford the possibility of going long on NEO for the next couple of weeks.
Author: Alex Paulson for Crypto-Rating.com
Top Cryptocurrencies with Price Predictions
| # | Crypto | Prediction | Accuracy | CVIX | Price | 24h | 7d | Market Cap | 7d price change | |
| 1 | Bitcoin predictions | 82% | 23 | $64 742.01 | 0.64% | 1.77% | $1 274 780 684 025 | |||
|---|---|---|---|---|---|---|---|---|---|---|
| 2 | Ethereum predictions | 76.4% | 51 | $3 172.49 | 0.83% | 3.31% | $387 195 965 458 | |||
| 3 | Tether predictions | 94.8% | 1 | $1.000151 | 0.10% | -0.03% | $110 480 177 546 | |||
| 4 | Binance Coin predictions | 88.8% | 19 | $613.50 | 0.94% | 11.20% | $90 545 078 851 | |||
| 5 | Solana predictions | 68% | 71 | $147.24 | -1.60% | 4.31% | $65 823 089 907 | |||
| 6 | USD Coin predictions | 92.8% | 2 | $1.000116 | 0.02% | 0.01% | $33 249 140 497 | |||
| 7 | XRP predictions | 68% | 62 | $0.529314 | -0.40% | 5.30% | $29 180 648 027 | |||
| 8 | Dogecoin predictions | 68% | 60 | $0.153170 | 0.05% | 0.04% | $22 061 749 961 | |||
| 9 | Toncoin predictions | 67.2% | 66 | $5.50 | -2.44% | -15.91% | $19 105 766 327 | |||
| 10 | Cardano predictions | 63.2% | 72 | $0.477005 | -0.38% | 4.34% | $16 997 547 087 | |||
| 11 | SHIBA INU predictions | 62.4% | 82 | $0.000026 | 0.41% | 14.42% | $15 421 640 594 | |||
| 12 | Avalanche predictions | 64% | 68 | $36.13 | -2.09% | 2.94% | $13 663 299 708 | |||
| 13 | TRON predictions | 88% | 21 | $0.117251 | 3.17% | 7.44% | $10 267 623 783 | |||
| 14 | Lido stETH predictions | 90.8% | 1 | $2 941.39 | -0.40% | -3.32% | $10 258 752 564 | |||
| 15 | Wrapped TRON predictions | 85.2% | 19 | $0.117125 | 3.03% | 7.70% | $10 256 553 245 |


