


Qtum: To buy or to sell, that is the question
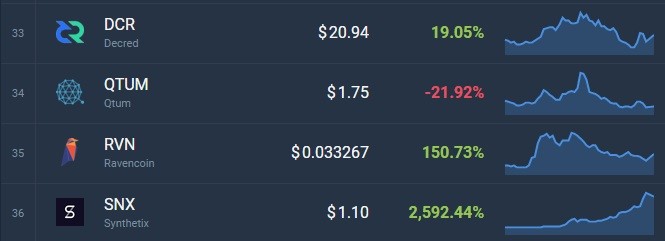
We are now at the tail end of 2019, so it is already safe to assess the yearly performance of all cryptocurrencies. There have been some magnificent gainers, like Synthetix (SNX), which has put a remarkable 2613% gains, and Matic Network (MATIC) with 699% increase. But, of course, there were many losers that had negative yearly performance.
The list of “losers” include Qtum (QTUM), a coin that has decreased in value by -21,96% over the course of the year. It can be viewed as a bad result, considering that most neighboring coins were in green this year. This could mean that Qtum can fall lower in the Coinmarketcap ranking (it presently holds the 34th spot) if the poor showings persist.
However, as every experienced trader knows, one shouldn’t rely only on bullish scenarios and build his trading strategy accordingly. The market always moves in waves; therefore, there is a high possibility that soon Qtum would reverse the bearish trend and enter the green territory. But that is unlikely to happen in the next couple of weeks.
How Qtum behaved in 2019
Judging from the year-to-date chart below, Qtum took an active part in a bull rally, which took place throughout this spring and summer.
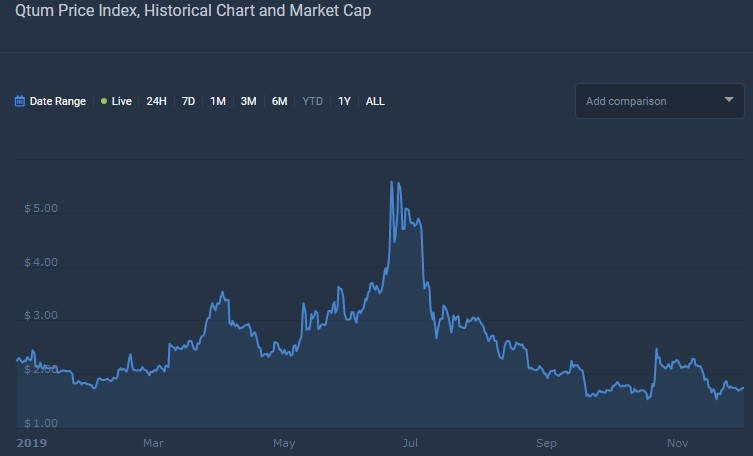
The green days of the crypto market ended abruptly at the beginning of August, so did the rapid rise of Qtum price, which had climbed to the height of $5.57, only to have a massive crash to the previous support level of $2,68. That fall marked the inception of a prolonged correction, which saw the price of Qtum sliding slowly but steadily to its current support zone at $1,6.
Interestingly, the price action of Qtum almost mimics the one of Ethereum, while having evident discrepancies with this year’s path of Bitcoin.
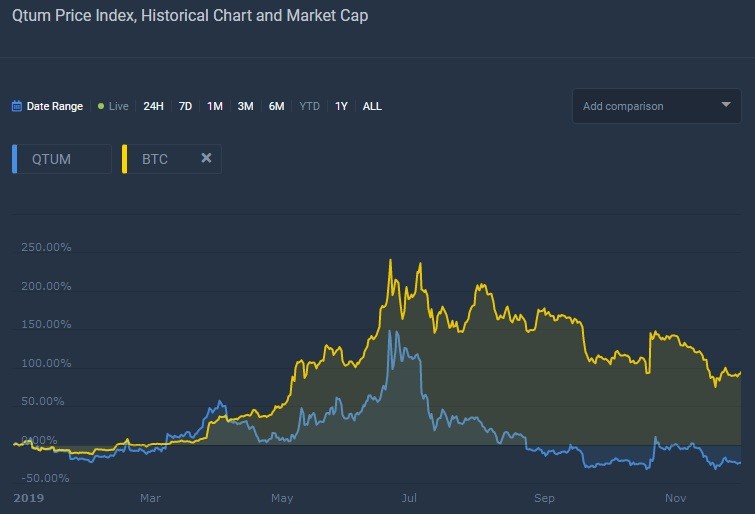
Bitcoin to Qtum comparison chart
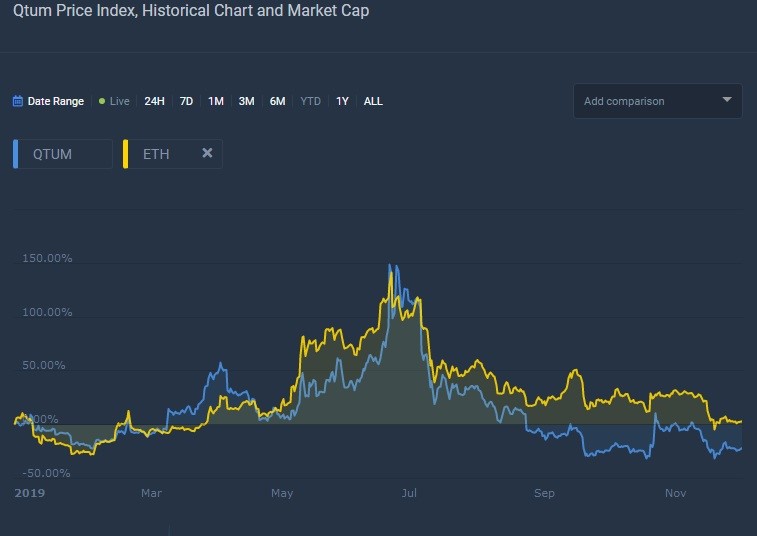
Ethereum to Qtum comparison chart
Traders who specialize in ETH should take this fact into account and consider the possibility of adding Qtum to their crypto portfolios, because it could open the opportunity for mirror trading.
To summarize, in 2019, Qtum has failed the holders who missed out on the chance to sell the coin somewhere during the bull rally, and now have to suffer through the lingering correction. But those traders who got acquainted with this cryptocurrency only a couple of months ago must now wait for a deeper dip, which should happen sooner rather than later, given Qtum’s unimpressive performance lately.
Even though Qtum holds the promise of future gains, its present situation is close to being dire. The vast majority of technical indicators are pointing at a strong sell, as seen on this meter.
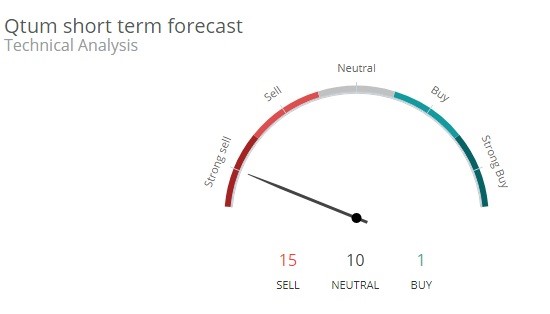
The 14-day Stoch RSI is screaming to sell, echoed by SMAs and EMAs on all time frames. The only indicator that suggests a buy is the 9-day Hull Moving Average - Stochastics and MACD remain neutral at this point.
All in all, the holders of Qtum should either sit tight or cut their losses, while the potential buyers could wait for another dip.
Author: Alex Paulson for Crypto-Rating.com


Top Cryptocurrencies with Price Predictions
| # | Crypto | Prediction | Accuracy | CVIX | Price | 24h | 7d | Market Cap | 7d price change | |
| 1 | Bitcoin predictions | 88% | 22 | $63 721.15 | 1.24% | -1.84% | $1 254 751 595 338 | |||
|---|---|---|---|---|---|---|---|---|---|---|
| 2 | Ethereum predictions | 80.4% | 40 | $3 305.01 | 6.06% | 4.29% | $403 386 347 528 | |||
| 3 | Tether predictions | 92% | 1 | $0.999514 | 0% | -0.07% | $110 509 187 408 | |||
| 4 | Binance Coin predictions | 86% | 26 | $602.45 | 1.33% | 3.79% | $88 890 787 484 | |||
| 5 | Solana predictions | 62.8% | 75 | $142.22 | 4.50% | -5.92% | $63 615 151 979 | |||
| 6 | USD Coin predictions | 94.4% | 2 | $1.000025 | 0% | 0% | $33 486 497 355 | |||
| 7 | XRP predictions | 66% | 67 | $0.520216 | 1.08% | -2.11% | $28 734 580 172 | |||
| 8 | Dogecoin predictions | 65.2% | 71 | $0.148883 | 2.73% | -8.01% | $21 449 343 129 | |||
| 9 | Toncoin predictions | 68% | 60 | $5.50 | 5.02% | -11.91% | $19 091 073 952 | |||
| 10 | Cardano predictions | 62.8% | 78 | $0.471892 | 3.71% | -5.97% | $16 817 729 834 | |||
| 11 | SHIBA INU predictions | 60.8% | 82 | $0.000025 | 1.05% | -7.25% | $14 606 809 046 | |||
| 12 | Avalanche predictions | 62% | 81 | $34.64 | 1.54% | -7.97% | $13 108 750 654 | |||
| 13 | TRON predictions | 88.4% | 21 | $0.120774 | 0.72% | 8.86% | $10 574 898 130 | |||
| 14 | Wrapped TRON predictions | 89.6% | 18 | $0.120639 | 0.54% | 8.45% | $10 563 049 844 | |||
| 15 | Lido stETH predictions | 93.6% | 1 | $2 941.39 | -0.40% | -3.32% | $10 258 752 564 |