


Ren (REN): Symmetrical Triangle on the Macro Level
The DeFi coin that represents the interoperability and liquidity protocol has been doing quite well this month as it gained 66.4% against USD, 34.8% against Bitcoin (BTC), and 38.6% in the Ethereum (ETH) pair. This result is especially significant, given that in the past two weeks, the price action has been existing in the context of a violent 35% pullback after the recovery bull run that followed the correction from this year’s high at $0.6.
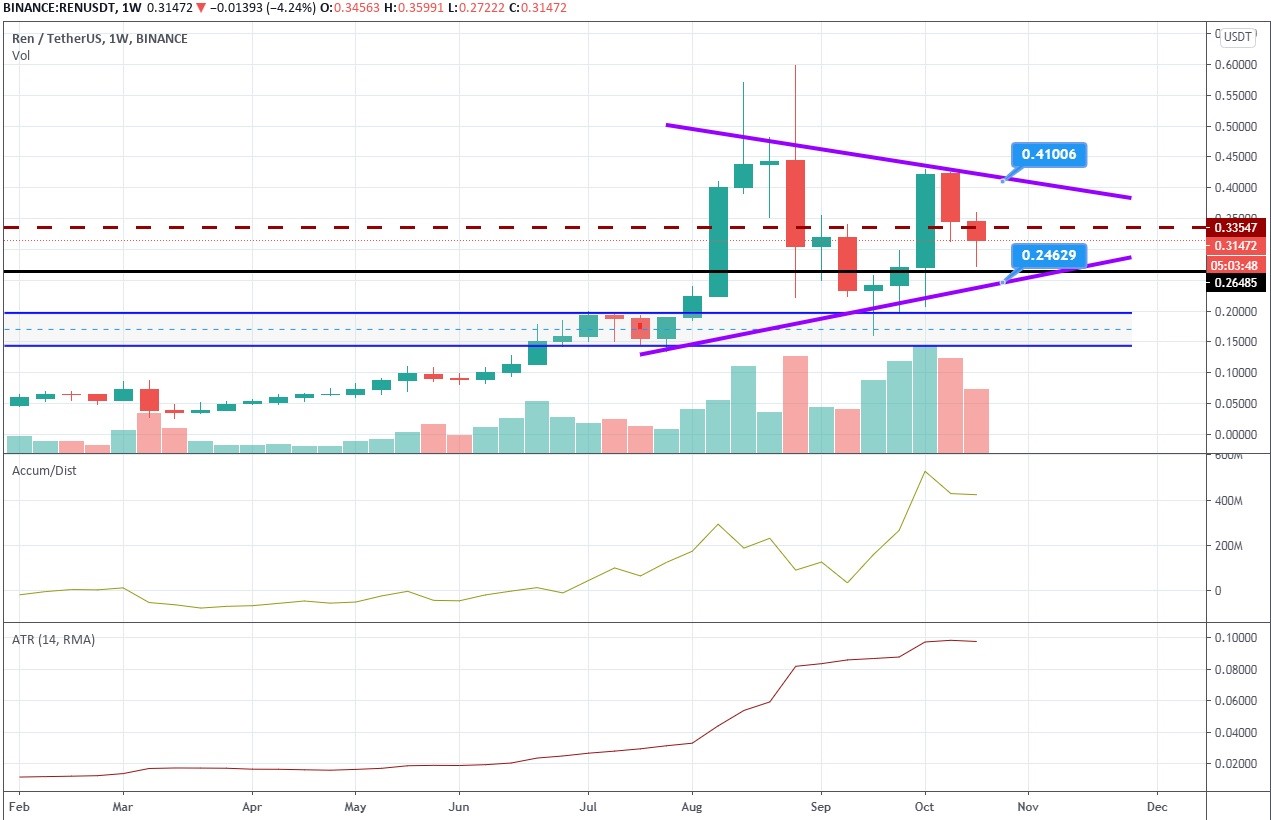
1-week REN/USDT chart
In the previous REN price prediction article, we were right to anticipate the bounce from the support level at $0.168 to $0.26, where REN encountered some resistance from the bears but managed to successfully overcome it and showcase another episode of explosive bull action that took the price to $0.42 (the lower high), and then the current retracement has kicked in and dragged REN back to $0.26, thus making it the ultimate magnetic point for the present cycle.
Consolidation before the resolution of the symmetrical triangle
The analysis of the average trading volume in the REN marketplace suggests that the participants might be preparing for a timeout after some intense price action of late. In the past 30 days, the volume has dropped significantly from the high of $314 million to $40 million in the last couple of days, which is one of the main prerequisites of consolidation that might well encompass the entire cryptocurrency market after the recent episode of bullish activity.
Consolidation would be the most logical path for REN at this junction because the price is clearly making its way to the apex of the symmetrical triangle on the weekly time frame while respecting the support at $0.264, but having the price level at $0.335 serving as an axis of the present market structure, and the area towards which the trading activity is going to narrow itself down over the course of the next six to ten weeks.
However, given that the Average True Range (ATR) indicator remains at high extremities near 0.1, the possibility of a broad move in either direction will remain high within the coming three weeks, during which time the price could travel either to $0.41 or $0.24, the upper and lower boundaries of the triangle.
Interestingly enough, the Accumulation/Distribution indicator also remains in the upper zone and in the uptrend. At the same time, the price has clearly made the lower high two weeks ago, which signals about the prevailing buying pressure, which, when combined with the ATR showings, suggests that the 20% move to the upside, towards the determined resistance line, is to be expected in the next two to three weeks. But upon that, the price action is likely to calm down significantly until the resolution of the symmetrical triangle.
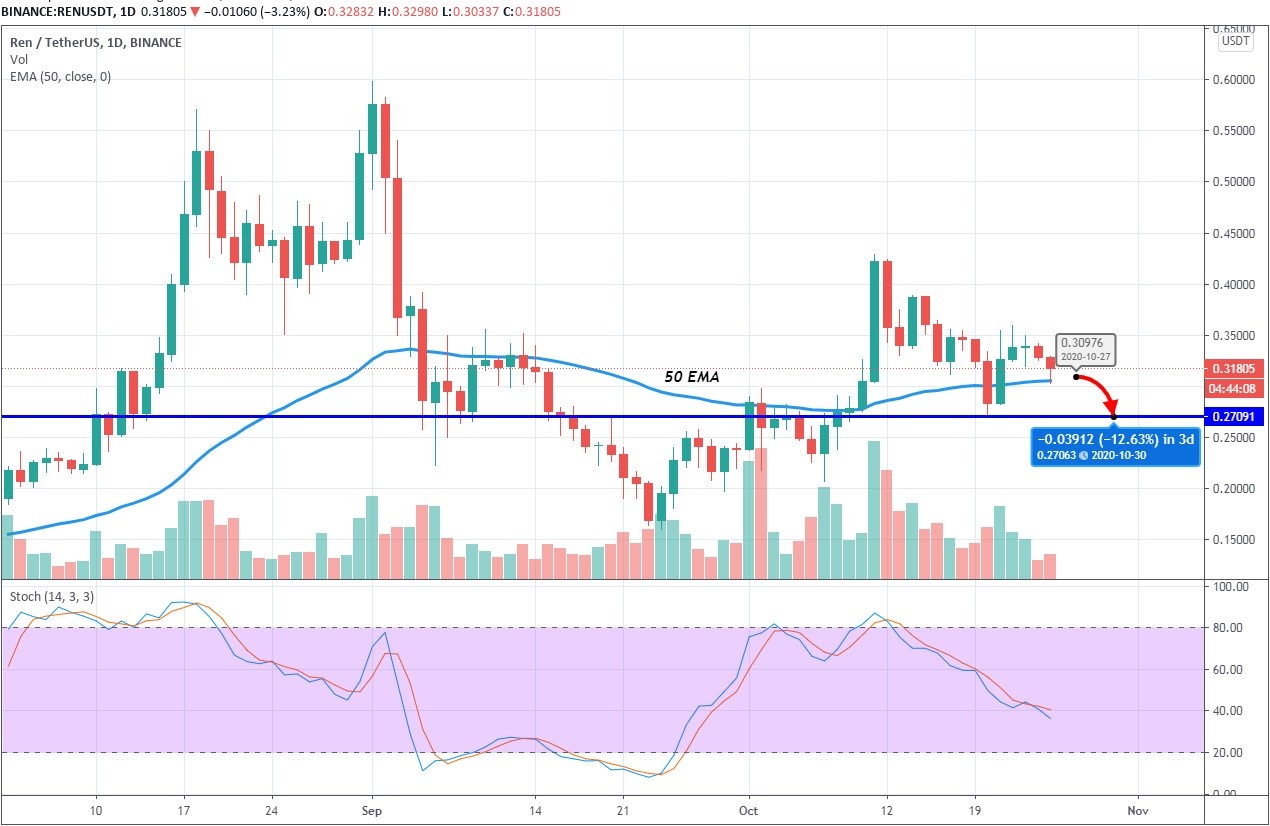
1-day REN/USDT chart
On the weekly chart, we see that REN is trying desperately to hold onto the support provided by the 50 EMA, though the price is likely to cross it to the downside as the last bullish move was reversed with an engulfing bearish candle, while Stochastic is plunging down to the oversold zone. In that case, REN will drop by another 11.8% to the area of frequent price interaction at $0.268.
Author: Alex Paulson for Crypto-Rating.com


Top Cryptocurrencies with Price Predictions
| # | Crypto | Prediction | Accuracy | CVIX | Price | 24h | 7d | Market Cap | 7d price change | |
| 1 | Bitcoin predictions | 73.6% | 54 | $67 992.56 | 1.35% | 2.18% | $1 341 608 846 080 | |||
|---|---|---|---|---|---|---|---|---|---|---|
| 2 | Ethereum predictions | 73.2% | 47 | $3 268.77 | 0.51% | -6.28% | $392 998 641 636 | |||
| 3 | Tether predictions | 94.4% | 1 | $1.000111 | 0.02% | -0.05% | $114 341 903 845 | |||
| 4 | Solana predictions | 66.8% | 71 | $187.15 | 5.00% | 10.88% | $86 950 076 572 | |||
| 5 | Binance Coin predictions | 78% | 42 | $587.18 | 1.64% | -0.31% | $85 685 293 473 | |||
| 6 | USD Coin predictions | 93.2% | 1 | $1.000122 | 0.01% | 0.01% | $34 147 378 826 | |||
| 7 | XRP predictions | 57.2% | 86 | $0.600376 | -0.28% | 1.62% | $33 597 543 281 | |||
| 8 | Dogecoin predictions | 74% | 55 | $0.134249 | 3.50% | 5.97% | $19 504 454 105 | |||
| 9 | Toncoin predictions | 81.2% | 29 | $6.72 | -0.41% | -8.16% | $16 914 629 714 | |||
| 10 | Cardano predictions | 76.4% | 49 | $0.416969 | 0.87% | -4.75% | $14 970 823 076 | |||
| 11 | TRON predictions | 85.6% | 18 | $0.137122 | 0.49% | 1.69% | $11 938 028 529 | |||
| 12 | Avalanche predictions | 75.2% | 40 | $28.57 | 1.38% | 1.50% | $11 278 950 659 | |||
| 13 | Lido stETH predictions | 96% | 1 | $2 941.39 | -0.40% | -3.32% | $10 258 752 564 | |||
| 14 | Wrapped TRON predictions | 90.8% | 1 | $0.116354 | -0.46% | 0.23% | $10 171 995 609 | |||
| 15 | SHIBA INU predictions | 82% | 29 | $0.000017 | 2.28% | -3.53% | $10 112 019 376 |