


Ren (REN) Gets Back to Square One
Unlike the majority of fellow DeFi cryptocurrencies that were able to withstand the bearish pressure that began mounting at the beginning of September, Ren (REN) appears to be finalizing the price cycle after making a dramatic U-turn and getting back below $0.2 upon completing a phenomenal run to $0.56.

Year-to-date REN chart
A continuing price decline or a bullish reversal?
Traders who were a part of the REN/USDT market during the summer must have had quite a rollercoaster ride since the token that serves as the lifeblood for RenVM that offers the interoperability solution to the DeFi sector has had an astonishing bull rally that began after the project announced the launch of mainnet back in May.
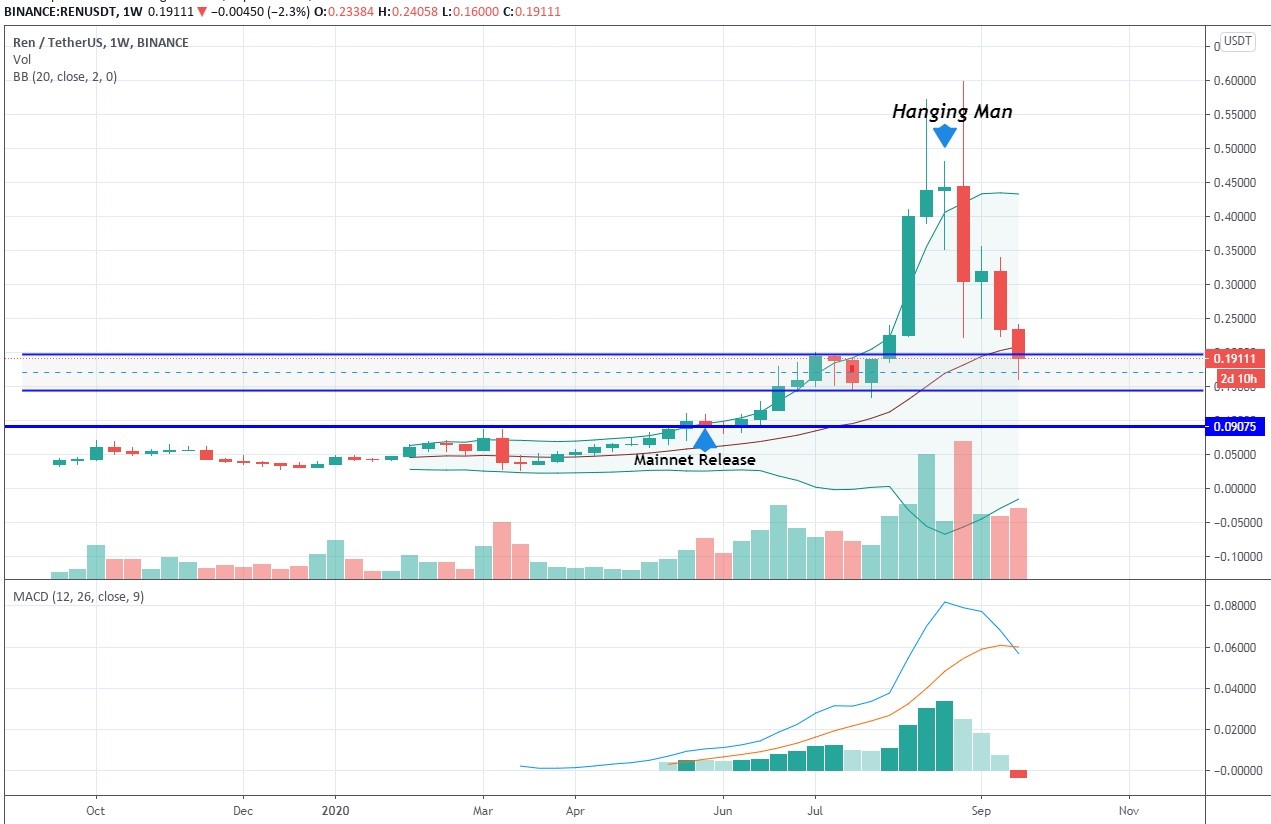
1-week REN/USDT chart
Ren has been among top gainers on the market in the period from May until the end of August, having made over 700% to the upside in the course of the powerful rally that had been briefly brought to a halt only once, when the price stumbled at the resistance at $0.2 on its way to the all-time high at $0.59, recorded on September 1.
Before the reversal, REN had given clear signals to traders - first, when it got pressurized down from $0.57 to $0.42, which revealed the sellers’ intention to defend that level, and the second one came in the form of the hanging man candlestick, which is a textbook bearish reversal signal.
The first week of September was absolutely disastrous for Ren as it lost 63% immediately after hitting the all-time high, which must have come as a shock to most retail traders who were fooled by the spike to ATH and began to sell in panic when the price started crumbling.
All in all, in the past four weeks, REN lost 73.5% of its value to the bears and rolled back to the area between $0.15 and $0.19, where it had been consolidating at the initial stages of the rally.
At the moment, there are no signs of even the slightest effort from the buyers to turn the tables in their favor as the sellers are producing significant trading volume, comparable to the one seen during the bullish phase.
In addition, MACD presented the fully-formed bearish crossover and the first red histogram in months, which could only mean that the downside momentum will persist and gain strength in the coming weeks, so traders should mentally prepare themselves for the rollback to $0.9, the starting position of the rally. There is a slight possibility that Ren would manage to cling to a straw and remain inside the designated consolidation channel for a while, but the overall outlook here is certainly bearish, so consider taking short trades on this time frame for the time being.
The daily time frame reveals an enormous cluster of bearish volume that was accompanying the price action since the second week of the month, whereas a rare spike of bullish activity has failed to pose any threat to the structure of the downtrend.
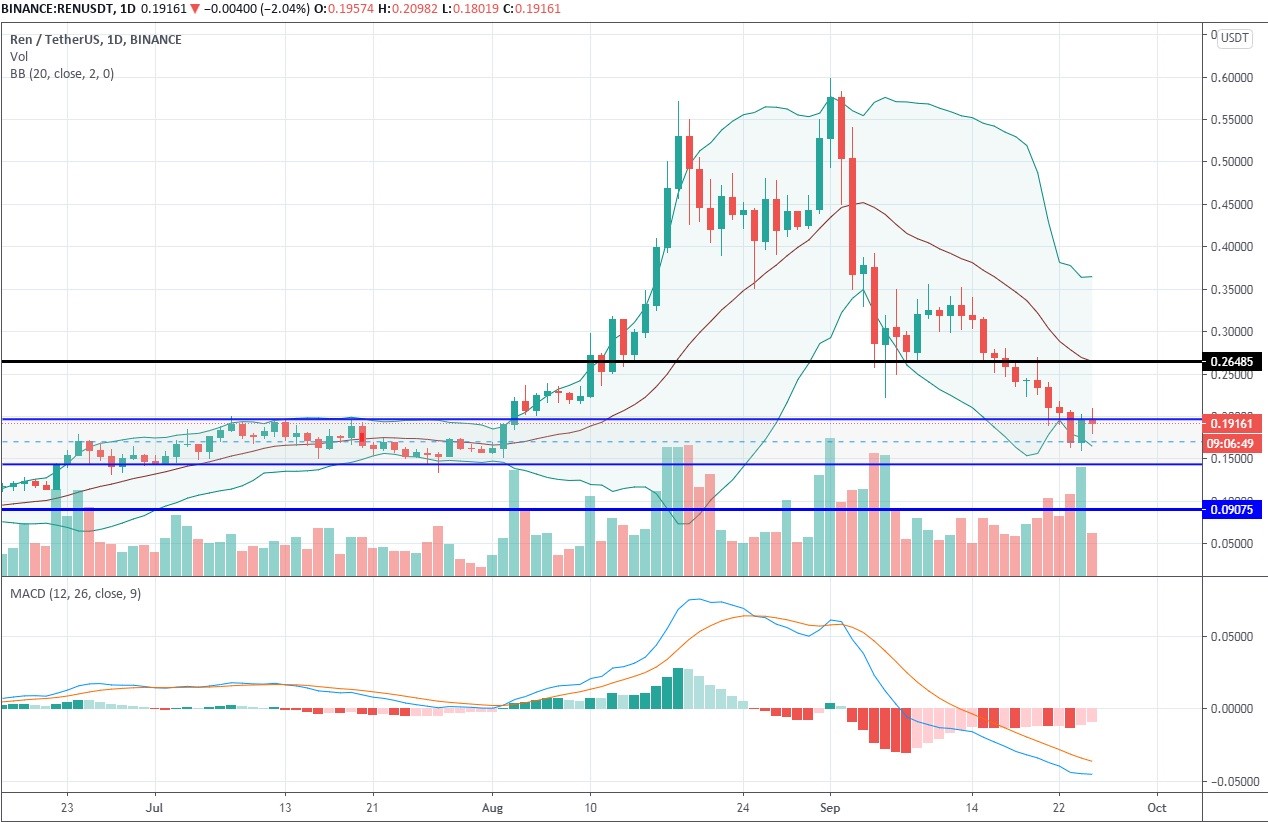
1-day REN/USDT chart
The fact that MACD is close to the oversold extreme at -0.05, and that the price action already takes place in the lower BB band, suggests that the price might bounce to $0.26, a 30% gain, over the next ten days, which presents an opportunity for a quick trade after the breakout above $0.2.
Author: Alex Paulson for Crypto-Rating.com


Top Cryptocurrencies with Price Predictions
| # | Crypto | Prediction | Accuracy | CVIX | Price | 24h | 7d | Market Cap | 7d price change | |
| 1 | Bitcoin predictions | 74.4% | 54 | $68 221.63 | 1.27% | 2.38% | $1 346 132 518 889 | |||
|---|---|---|---|---|---|---|---|---|---|---|
| 2 | Ethereum predictions | 76.8% | 47 | $3 277.70 | 0.62% | -6.01% | $394 072 124 681 | |||
| 3 | Tether predictions | 95.6% | 1 | $1.000294 | 0.04% | -0.03% | $114 362 869 613 | |||
| 4 | Solana predictions | 64.4% | 70 | $186.46 | 3.76% | 10.05% | $86 651 629 563 | |||
| 5 | Binance Coin predictions | 77.6% | 42 | $588.60 | 1.71% | -0.56% | $85 893 706 101 | |||
| 6 | USD Coin predictions | 90.8% | 1 | $1.000218 | 0.01% | 0.02% | $34 165 068 764 | |||
| 7 | XRP predictions | 62.4% | 86 | $0.601322 | 0.08% | 1.60% | $33 650 519 304 | |||
| 8 | Dogecoin predictions | 72% | 55 | $0.135778 | 4.40% | 6.72% | $19 726 589 838 | |||
| 9 | Toncoin predictions | 83.6% | 31 | $6.74 | -0.27% | -8.09% | $16 954 582 289 | |||
| 10 | Cardano predictions | 75.2% | 49 | $0.417851 | 0.74% | -4.48% | $15 002 527 040 | |||
| 11 | TRON predictions | 86.4% | 18 | $0.137290 | 0.44% | 2.02% | $11 952 578 512 | |||
| 12 | Avalanche predictions | 77.6% | 38 | $28.70 | 1.64% | 1.95% | $11 330 467 420 | |||
| 13 | Lido stETH predictions | 93.2% | 1 | $2 941.39 | -0.40% | -3.32% | $10 258 752 564 | |||
| 14 | SHIBA INU predictions | 84.4% | 30 | $0.000017 | 2.35% | -3.05% | $10 173 129 198 | |||
| 15 | Wrapped TRON predictions | 90.8% | 1 | $0.116354 | -0.46% | 0.23% | $10 171 995 609 |