


Ravencoin (RVN): Aiming High Against Bitcoin
Traders who seized the opportunity to buy Ravencoin (RVN) when it had hit the all-time low at $0.08 must now be wondering where they should exit their position and take the profit, mainly because RVN has never been considered as a “moon coin,” meaning that one could hardly expect any substantial price leaps from a currency situated at the borderline of top 50, with a not overly impressive average daily trading volume of $6 million to $10 million.
RVN is indeed not the currency that delivers massive gains in a short span of time. For instance, during the last four weeks, the period that could be characterized by partial market recovery and stabilization, Ravencoin got in the green only against USD (24.2%), whereas its performance in comparison to that of Bitcoin and Ethereum was subpar.
Rising at turtle’s pace
However, these are probably the acceptable showing for a coin of this caliber since its closest neighbors in global rankings: Waves (WAVES) and Bitcoin Diamond (BCD) have had a similarly mediocre performance over that period of time.
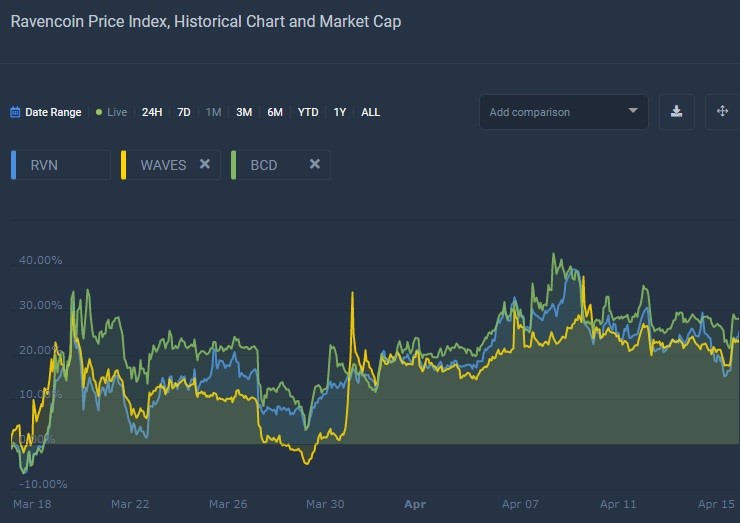
RVN/WAVES/BCD comparison chart
Nevertheless, Ravencoin is not failing or steering away from the general trend in the market, which is a good enough reason to try and make some money on the next price swing, which is due to happen soon in the RVN/USDT pair.
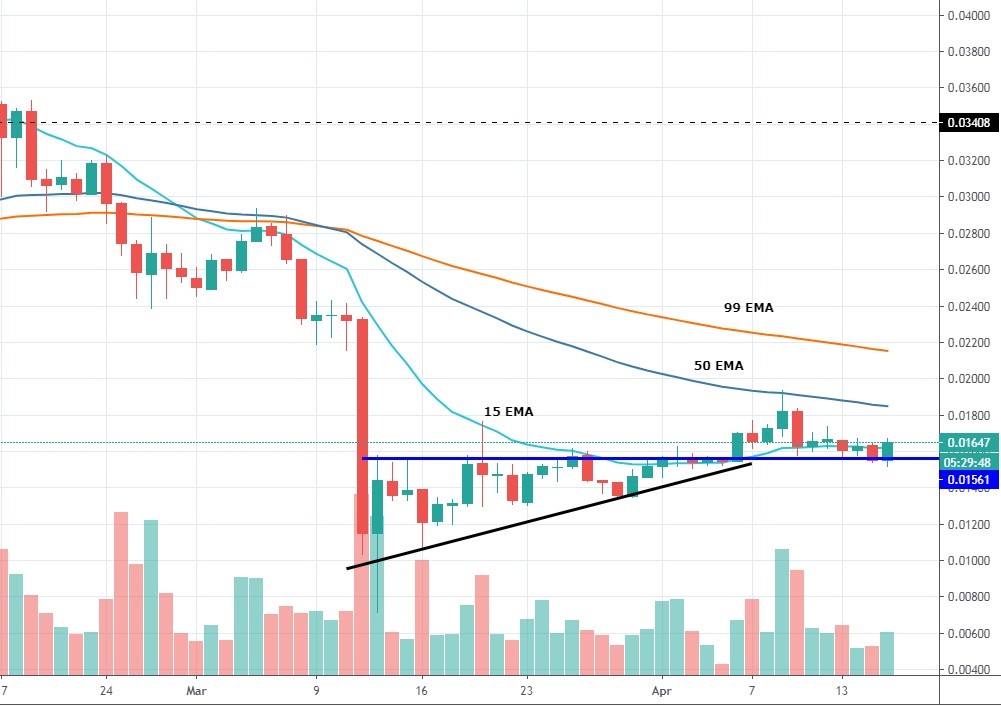
1-day RVN/USDT chart
As the title of this paragraph suggests, Ravencoin took its time to find an exit from the zone controlled by the bears. That zone has been located within the confines of the ascending wedge on the daily time frame. What most traders fail to appreciate about RVN is the exactitude with which it had been moving inside the structure of the wedge, bouncing off the resistance at $0.015 like a tennis ball. Those who recognized that pattern and followed it through should have made decent money and anticipated the break out of the formation to the upside.
The level at $0.0156 seems to be acting like a magnet for Ravencoin as the price has already retraced back to it upon the breakout. The strength of that level is amplified by the fact that it now coincides with the 15-period EMA, whereas RVN had already punctured the 50 EMA and is likely to re-test it with the next bullish move. However, the magnitude of that move, and the several following ones, should be of low-to-medium scale since all moving averages are running in parallel with no intention of forming a convergence. If the price does manage to hold its ground above $0.015, it is likely to get squeezed into a range between the 15 EMA and 50 EMA.
Interesting developments in the Bitcoin pair
While the situation in the pair with USDT pair appears a bit dull, the price movement in the RVN/BTC one is quite different. Right now, the price of Ravencoin is consolidating at the two-year low at 230 satoshis, having entered a tight Bollinger Band squeeze, which is a harbinger of volatility.

1-day RVN/BTC chart
But most importantly, the chart on the daily time frame shows a clear-cut bullish divergence that began forming right after the market crash. Therefore, here we have a high probability of the commencement of an uptrend upon the resolution of the BB squeeze.
Author: Alex Paulson for Crypto-Rating.com


Top Cryptocurrencies with Price Predictions
| # | Crypto | Prediction | Accuracy | CVIX | Price | 24h | 7d | Market Cap | 7d price change | |
| 1 | Bitcoin predictions | 81.6% | 26 | $62 581.52 | -2.82% | -1.78% | $1 232 274 056 286 | |||
|---|---|---|---|---|---|---|---|---|---|---|
| 2 | Ethereum predictions | 76.4% | 43 | $3 092.33 | -1.80% | 1.20% | $377 422 868 005 | |||
| 3 | Tether predictions | 92% | 1 | $0.999903 | -0.02% | -0.07% | $110 415 057 605 | |||
| 4 | Binance Coin predictions | 83.2% | 22 | $587.28 | -3.88% | 5.38% | $86 675 077 068 | |||
| 5 | Solana predictions | 67.2% | 70 | $134.92 | -6.19% | -5.29% | $60 328 304 016 | |||
| 6 | USD Coin predictions | 94.8% | 2 | $1.000110 | -0.02% | -0.01% | $33 467 965 584 | |||
| 7 | XRP predictions | 68.4% | 69 | $0.514705 | -1.72% | 1.68% | $28 430 209 369 | |||
| 8 | Dogecoin predictions | 67.2% | 68 | $0.144143 | -3.96% | -7.68% | $20 763 960 737 | |||
| 9 | Toncoin predictions | 66.8% | 65 | $5.27 | -1.80% | -14.04% | $18 282 328 172 | |||
| 10 | Cardano predictions | 64.4% | 81 | $0.451818 | -4.06% | -5.90% | $16 100 189 712 | |||
| 11 | SHIBA INU predictions | 64% | 82 | $0.000024 | -4.25% | 5.67% | $14 406 279 325 | |||
| 12 | Avalanche predictions | 60% | 78 | $33.40 | -5.85% | -4.47% | $12 630 611 155 | |||
| 13 | Wrapped TRON predictions | 88.8% | 18 | $0.119353 | 2.19% | 8.54% | $10 450 913 619 | |||
| 14 | TRON predictions | 88.4% | 21 | $0.119116 | 1.74% | 8.00% | $10 430 161 283 | |||
| 15 | Lido stETH predictions | 93.6% | 1 | $2 941.39 | -0.40% | -3.32% | $10 258 752 564 |