


Ravencoin (RVN) Establishes a Comfortable Range
There are different types of traders: some get the thrill from fishing out the coins that are about to rally, or collapse, others base their trading strategies around trend direction, trying to catch upswings and retracements, while some traders are actually more comfortable trading in the range because it offers more predictability than the other two. That’s why, in order to satisfy the interest of all groups of traders in our price forecasts, we are going to analyze Ravencoin (RVN), the price of which has been locked in the multi-week range that is not overly complicated to determine.
RVN keeps on providing opportunities for trading in the range
Frankly speaking, we wouldn’t recommend Ravecoin for immediate investing or long-term trading, unless you are planning to short this cryptocurrency. Since last June, RVN has been in a perpetual downtrend after visiting the all-time high at $0.08, losing 64% of its USD value in a year, and falling behind Bitcoin and Ethereum by 58% and 54%, respectively.
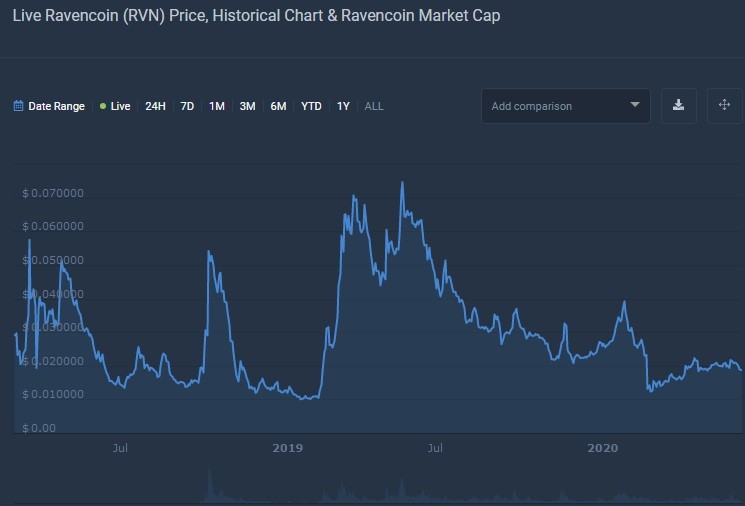
RVN historical price chart
Judging from the direction of the general trend, Ravencoin shows a proclivity to the bearish price action, so the revisit to the historical low at $0.01 is highly probable. But for the time being, RVN is locked in the range that provides ample opportunities for profit-making.
The trading channel, within which the current price action takes place, began to form on May 25, after the price went through the resistance at $0.018 that now serves as firm support.
Over the following two months, Ravencoin established the resistance at $0.022 that has already been tested on multiple occasions. Besides, like any other ranging cryptocurrency, RVN is very respectful of Bollinger Bands, so setting the buy or sell target either at the higher or the lower band would be the most practical things to do right now.
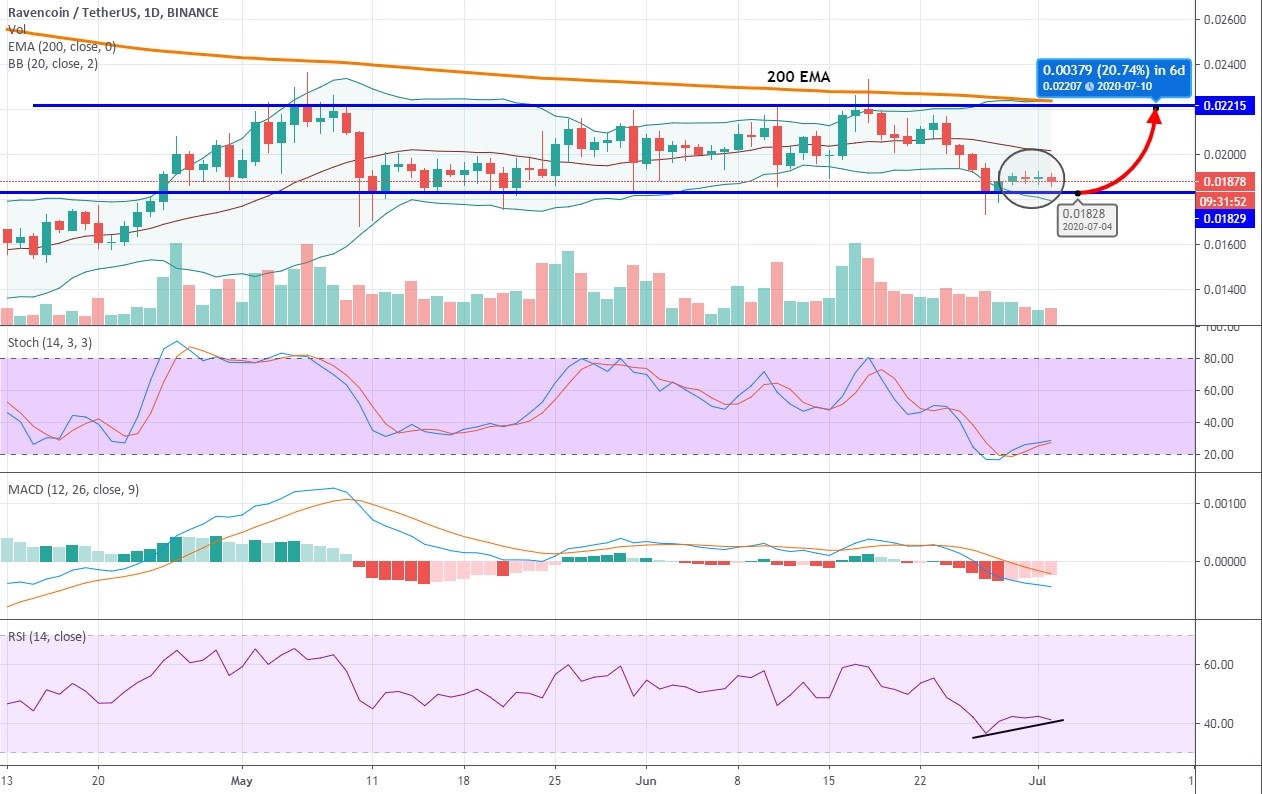
1-day RVN/USDT chart
Actually, determining the top of the range is much easier since the trend-setting 200-period EMA runs at close proximity to the established resistance at $0.022. Given the bearish context of this market, it is safe to assume that the price will be rejected aggressively once it reaches that level again. At the moment, we see four spinning tops in a row on the daily time frame that is just a small reflection of the overall indecision in this cryptocurrency pair. The price could still take a little dip to $0.182, but major indicators hint at the approaching bullish impulse to the designated zone, which could constitute a 20% move.
- Stochastic has been serving rather well at determining the tops and the bottoms of the current range. On June 29, Stochastic made the bullish crossover at the oversold zone and kept plodding northward while the price remained flat, which gives us a hidden bullish divergence;
- MACD is deep in the bearish territory, but it is already very close to the oversold extreme at -0.005, although the indicator lines still remain far apart.
The 14-period RSI also reveals a hidden bullish divergence, but in order to confirm it, the indicator needs to make a higher low at 40.
Given how dull the cryptocurrency market is at the moment, we predict that after the expected bullish swing to $0.20 - $0.22, Ravencoin will once again get pulled back to the support line.
Author: Alex Paulson for Crypto-Rating.com


Top Cryptocurrencies with Price Predictions
| # | Crypto | Prediction | Accuracy | CVIX | Price | 24h | 7d | Market Cap | 7d price change | |
| 1 | Bitcoin predictions | 87.2% | 23 | $64 837.84 | 1.21% | 2.14% | $1 276 667 564 847 | |||
|---|---|---|---|---|---|---|---|---|---|---|
| 2 | Ethereum predictions | 72.4% | 51 | $3 174.86 | 1.45% | 3.51% | $387 485 564 544 | |||
| 3 | Tether predictions | 94% | 1 | $0.999855 | 0.06% | -0.07% | $110 447 532 693 | |||
| 4 | Binance Coin predictions | 85.2% | 20 | $616.92 | 1.30% | 12.17% | $91 050 425 745 | |||
| 5 | Solana predictions | 63.2% | 71 | $147.40 | -1.03% | 5.06% | $65 893 071 142 | |||
| 6 | USD Coin predictions | 90.8% | 2 | $1.000092 | 0% | 0% | $33 248 320 251 | |||
| 7 | XRP predictions | 68.8% | 62 | $0.530614 | -0.21% | 5.70% | $29 252 294 419 | |||
| 8 | Dogecoin predictions | 68% | 60 | $0.153019 | 0.23% | 1.26% | $22 039 903 315 | |||
| 9 | Toncoin predictions | 69.6% | 66 | $5.51 | -0.96% | -15.70% | $19 140 730 708 | |||
| 10 | Cardano predictions | 66% | 72 | $0.475569 | -0.48% | 4.39% | $16 946 387 500 | |||
| 11 | SHIBA INU predictions | 61.2% | 82 | $0.000026 | 1.40% | 15.15% | $15 461 237 537 | |||
| 12 | Avalanche predictions | 66% | 68 | $35.96 | -2.25% | 2.96% | $13 600 508 101 | |||
| 13 | TRON predictions | 86% | 21 | $0.117297 | 3.22% | 7.59% | $10 271 669 223 | |||
| 14 | Lido stETH predictions | 91.2% | 1 | $2 941.39 | -0.40% | -3.32% | $10 258 752 564 | |||
| 15 | Wrapped TRON predictions | 85.2% | 19 | $0.116953 | 2.88% | 7.58% | $10 241 543 166 |