Ravencoin (RVN) is Flying High Right Now
The cryptocurrency market is booming right now - over the past seven days, around 70% of all cryptocurrencies have shown gains, most of which were double figures. Ravencoin (RVN) is no exception. In fact, despite being placed near the bottom of Coinmarketcap’s top 50 - RVN currently holds the 39th spot - that cryptographic currency turned out to be one of the hardest gainers in 2019 and at the beginning of 2020.
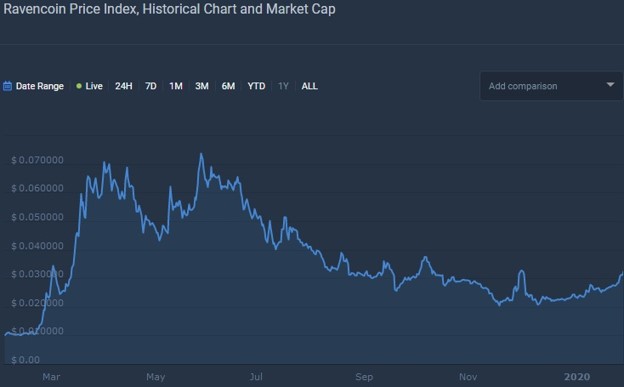
Over the last 12 months, Ravencoin got its value boosted by 255% - quite a good showing for a project whose fundamentals doesn’t go beyond the blockchain-enabled system for transfer of digital assets, ASIC resistance, and a relatively fair system of coin distribution and rewards.

1-year price chart of Ravencoin
The Ravencoin ecosystem does possess an interesting feature that constitutes in the provision of means for issuing tokens right on the platform. The project is driven by the community of developers that slows down the process of update releases and system upgrades, which there would be none in the near future, except for the minor upgrade of Ravencoin’s proprietary digital wallet.
Therefore, when trading Ravencoin, one should pay more attention to the price action itself, instead of relying on the fundamental value of the coin, which is likely to increase at a slow pace.
Ravencoin is capable of generating respectable gains
Although Ravencoin is a coin that doesn’t often appear in the news to cause a media hype that catalyzes the price action, it has decent traction among traders on such cryptocurrency exchanges like Binance (28% of the overall trading volume), DigiFinex (32%), and Upbit (8%). Given that the first two platforms are ranked among the top 10 by liquidity, RVN is actively traded, reaching an average daily trading volume of $39 million. Over the last month alone, Ravencoin gained nearly 50% against the US Dollar and 20% against Bitcoin. So those who are preparing for the much-expected altseason, should consider supplementing their portfolio with RVN, because it has proven historically to be one of the strongest currencies from beyond top 10, though it’s not a stranger to volatility.
The situation on the charts
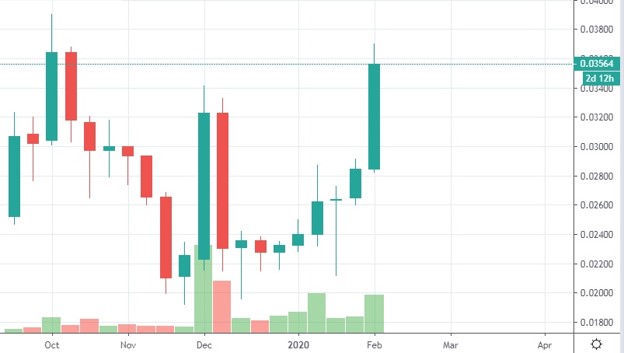
Let’s take a step back and look at the broader picture of RVN’s price development; in other words, the weekly chart.

1-week RVN/USDT chart
It’s evident from the chart that Ravencoin is moving in a way where a significant price leap is always followed by nearly as strong a pullback, from which the market continues the development in either direction. Traders should also take notice of big lower wicks that could be detrimental for stop-losses. This chart says that this week’s price surge of nearly 30% against USDT could be running its course, so traders should prepare for a retracement.
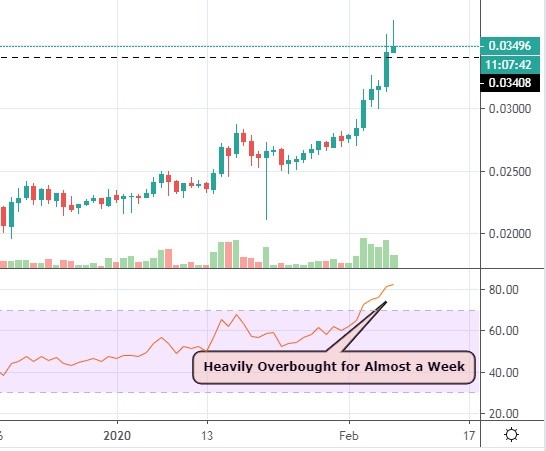
The daily chart supports the notion of an imminent pullback as the price had successfully breached the resistance at $0.034, which stood since December 2019, and is now going through a phase of traders’ remorse.

1-day RVN/USDT chart
Moreover, the 14-period RSI has been way beyond the border of the overbought zone for several days in a row, which is a definite sign that the market is about to experience the price drop. After that, Ravencoin should keep on moving higher towards the $0.04 resistance.
Author: Alex Paulson for Crypto-Rating.com
Top Cryptocurrencies with Price Predictions
| # | Crypto | Prediction | Accuracy | CVIX | Price | 24h | 7d | Market Cap | 7d price change | |
| 1 | Bitcoin predictions | 84.4% | 25 | $63 997.98 | -4.17% | 4.57% | $1 260 116 830 170 | |||
|---|---|---|---|---|---|---|---|---|---|---|
| 2 | Ethereum predictions | 76.4% | 49 | $3 135.97 | -3.71% | 5.31% | $382 739 337 134 | |||
| 3 | Tether predictions | 92% | 1 | $0.999789 | -0.03% | -0.05% | $110 440 200 420 | |||
| 4 | Binance Coin predictions | 85.6% | 18 | $608.02 | -0.06% | 11.85% | $89 736 639 262 | |||
| 5 | Solana predictions | 63.6% | 71 | $146.29 | -7.55% | 12.76% | $65 398 567 231 | |||
| 6 | USD Coin predictions | 96% | 2 | $1.000042 | 0% | 0.01% | $33 441 306 163 | |||
| 7 | XRP predictions | 72% | 62 | $0.523377 | -4.49% | 6.67% | $28 853 346 344 | |||
| 8 | Dogecoin predictions | 69.2% | 60 | $0.151351 | -6.56% | 2.44% | $21 798 428 537 | |||
| 9 | Toncoin predictions | 66.8% | 66 | $5.47 | -7.58% | -7.01% | $19 006 158 758 | |||
| 10 | Cardano predictions | 67.6% | 72 | $0.473273 | -6.80% | 7.53% | $16 864 567 310 | |||
| 11 | SHIBA INU predictions | 59.2% | 82 | $0.000025 | -8.34% | 15.05% | $14 670 236 103 | |||
| 12 | Avalanche predictions | 68% | 66 | $35.42 | -9.86% | 6.19% | $13 390 946 319 | |||
| 13 | Lido stETH predictions | 94% | 1 | $2 941.39 | -0.40% | -3.32% | $10 258 752 564 | |||
| 14 | Polkadot predictions | 66.8% | 64 | $6.96 | -6.08% | 4.48% | $10 002 091 467 | |||
| 15 | TRON predictions | 87.6% | 21 | $0.114038 | 0.39% | 4.26% | $9 986 769 809 |


