


Kyber Network (KNC) is Stuck at the Macro Resistance
Since Kyber Network (KNC) is the token that’s taking an active part in the ongoing DeFi frenzy, it’s no wonder that it has been rallying significantly over the past several months.
Just a quick reminder that KNC represents an on-chain liquidity protocol that provides means for incorporating the token swaps and ERC-20 payment features into virtually any decentralized application on Ethereum. Therefore, Kyber Network is supplementing a very important functional capability to many products related to decentralized finance, so its fundamental value for the given niche is beyond question.
Understandably, the value that KNC brings to the table should translate to decent bullish price action. Indeed, Kyber Network has made stunning progress over the past year, having gained 782% against USD; 684% in the BTC market; 330% when paired with ETH. This made KNC one of the best performers on the entire market, rivaled only by a few other altcoin prodigies, such as Aave (LEND) with its mind-boggling 20,000% gain, Ocean Protocol (OCEAN) that went up in value by 2,500%, and several other altcoins.
Nevertheless, even such the applause-deserving performance still leaves Kyber Network at a very large distance of 80% from the all-time high at $6 - the token is currently priced at $1.61, established after a very modest 7% price appreciation over the past month. It is evident from the performance table below that KNC has been slowly drained of the upside energy by the sellers, forcing its gains to stumble for a while, confirmed by the price action on the charts.
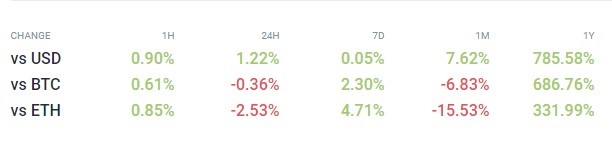
KNC performance profile
Kyber Network stumbles at the first macro resistance level
For a comprehensive Kyber Network price analysis, let’s take a look at the price action on the weekly chart first to determine the key levels of support and resistance that the price is going to interact with on its presumed path to the mentioned all-time high.
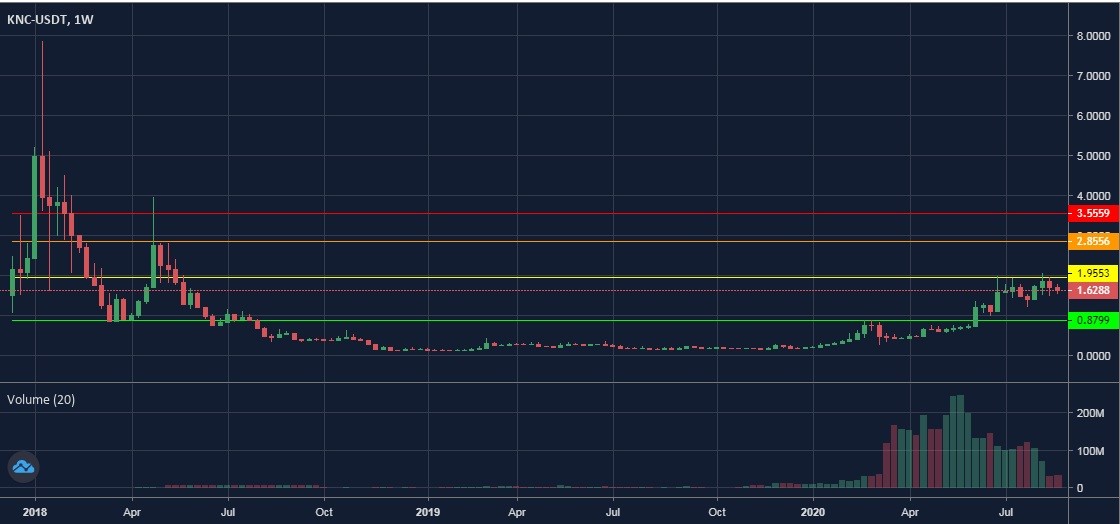
1-week KNC/USDT chart
- $1.95 - the standing resistance area that the price has failed to breach even after several attempts, so at the moment, the bears are vehemently defending it. Watch out for the breakout here on the back of the rising volume as it will bear no less than 20% gains;
- $2.85 - the next level of resistance that also overlaps with the top of the last significant bull rally in 2018;
- $3.55 - the last line of defense for the sellers - failure to hold it will leave the bulls on a highway above the ATH.
Considering the drop in trading volume over the past two weeks, and the prevalence of sellers, we presume that the bulls are far from being ready for a breakout, which leaves KNC gridlocked between the support at $0.87 and the resistance at $1.95 for the time being. Look for the spike in bullish volume as the first prerequisite of the impending bull rally.
The occurrences on the daily time frame confirm the notion that the bullish momentum is fading.

1-day KNC/USDT chart
We see the shrinkage of upside impulses, accompanied by the increasing retracement, which is a sure sign that the sellers are mounting the pressure, as evident from the bearish divergence on RSI, so traders should expect that ongoing pullback could be deeper than the previous one and take KNC to the support at $1.26 or even slightly below it.
Author: Alex Paulson for Crypto-Rating.com


Top Cryptocurrencies with Price Predictions
| # | Crypto | Prediction | Accuracy | CVIX | Price | 24h | 7d | Market Cap | 7d price change | |
| 1 | Bitcoin predictions | 73.6% | 54 | $67 992.56 | 1.35% | 2.18% | $1 341 608 846 080 | |||
|---|---|---|---|---|---|---|---|---|---|---|
| 2 | Ethereum predictions | 73.2% | 47 | $3 268.77 | 0.51% | -6.28% | $392 998 641 636 | |||
| 3 | Tether predictions | 94.4% | 1 | $1.000111 | 0.02% | -0.05% | $114 341 903 845 | |||
| 4 | Solana predictions | 66.8% | 71 | $187.15 | 5.00% | 10.88% | $86 950 076 572 | |||
| 5 | Binance Coin predictions | 78% | 42 | $587.18 | 1.64% | -0.31% | $85 685 293 473 | |||
| 6 | USD Coin predictions | 93.2% | 1 | $1.000122 | 0.01% | 0.01% | $34 147 378 826 | |||
| 7 | XRP predictions | 57.2% | 86 | $0.600376 | -0.28% | 1.62% | $33 597 543 281 | |||
| 8 | Dogecoin predictions | 74% | 55 | $0.134249 | 3.50% | 5.97% | $19 504 454 105 | |||
| 9 | Toncoin predictions | 81.2% | 29 | $6.72 | -0.41% | -8.16% | $16 914 629 714 | |||
| 10 | Cardano predictions | 76.4% | 49 | $0.416969 | 0.87% | -4.75% | $14 970 823 076 | |||
| 11 | TRON predictions | 87.2% | 18 | $0.137122 | 0.49% | 1.69% | $11 938 028 529 | |||
| 12 | Avalanche predictions | 75.2% | 40 | $28.57 | 1.38% | 1.50% | $11 278 950 659 | |||
| 13 | Lido stETH predictions | 92% | 1 | $2 941.39 | -0.40% | -3.32% | $10 258 752 564 | |||
| 14 | Wrapped TRON predictions | 90.8% | 1 | $0.116354 | -0.46% | 0.23% | $10 171 995 609 | |||
| 15 | SHIBA INU predictions | 82% | 29 | $0.000017 | 2.28% | -3.53% | $10 112 019 376 |