


Ethereum (ETH): Hardly Anything Can Extinguish Its Bullishness
Despite big shifts that are happening at the top of global rankings, as Cardano (ADA) and Chainlink (LINK) are pushing down Litecoin (LTC) and Binance Coin (BNB), the positions of both dominant cryptocurrencies - BTC and ETH - remain unquestionable, especially in the face of the rise of popularity of DeFi and the heightened expectations around Ethereum 2.0.
The second cryptocurrency maintains a bullish stance, having gained 81% in the USD market during the past month and outpowered Bitcoin by 41.3%. As of the time of writing, ETH's price stands at $435 after the 2.15% increase in the last 24 hours. There has been a noticeable increase in the average trading volume since the middle of June from $5 billion to $18 billion at the previous upswing peak.
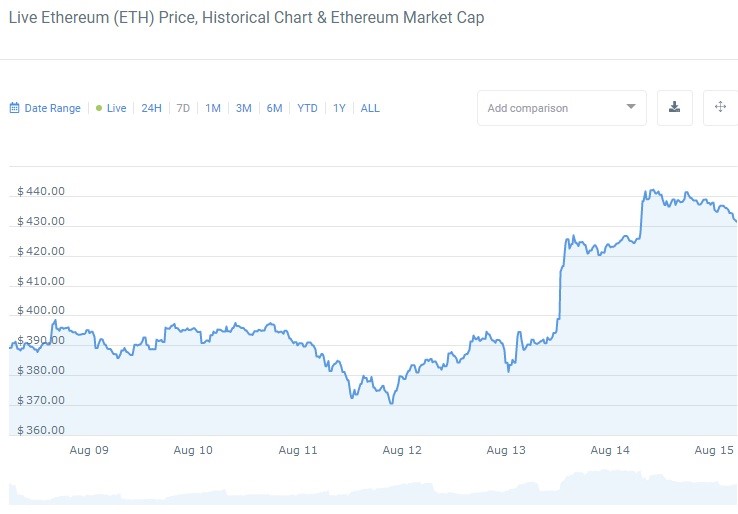
7-day ETH price action chart
The chart above shows that in the last seven days, Ethereum has positively resolved a bull flag formation on its way from $381 to $442. Clearly, the bullish sentiment is prevailing in this market, so traders should expect the continuation of the uptrend, unless some external factors, such as another market crisis caused by the second wave of COVID-19 - interfere with the price action and compromise the trend structure.
Overall bullish with an expected short spell of bearish action
With that being said, let's begin the ETH price analysis by examining the situation on the weekly time frame to determine key levels of future price interaction.
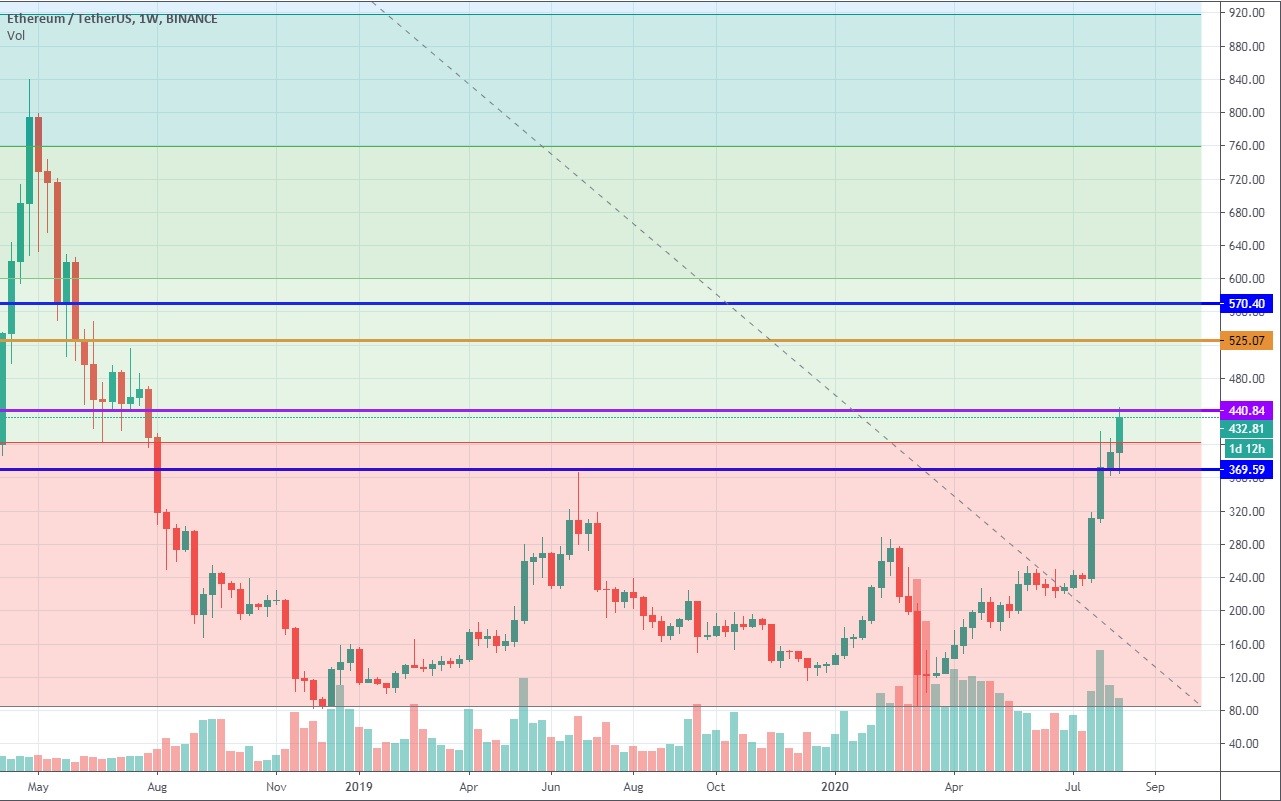
1-week ETH/USDT chart
The first such level stands at $440, which is now being tested by the buyers. This particular area represents a concern for the bullishly-oriented traders and an opportunity for those who intend to short Ethereum. The reason is that the trading volume has been decreasing since the emergence of the second weekly candle of this upswing, which is a warning sign of reducing demand for ETH, hence the probable price drop.
However, if Ethereum does break to the upside, which is also highly probable, given the current volatility of the asset, it will first test $525, with the highest price target being established at $570. Also, notice that all these resistance areas lie within the 0.236 and 0.382 Fibonacci retracement levels that mark the second phase of uptrend development.
Switching now to the daily time frame for the more immediate Ethereum price prediction. Here you see how ETH was not allowed past $440 after spending some time testing the support at $369.
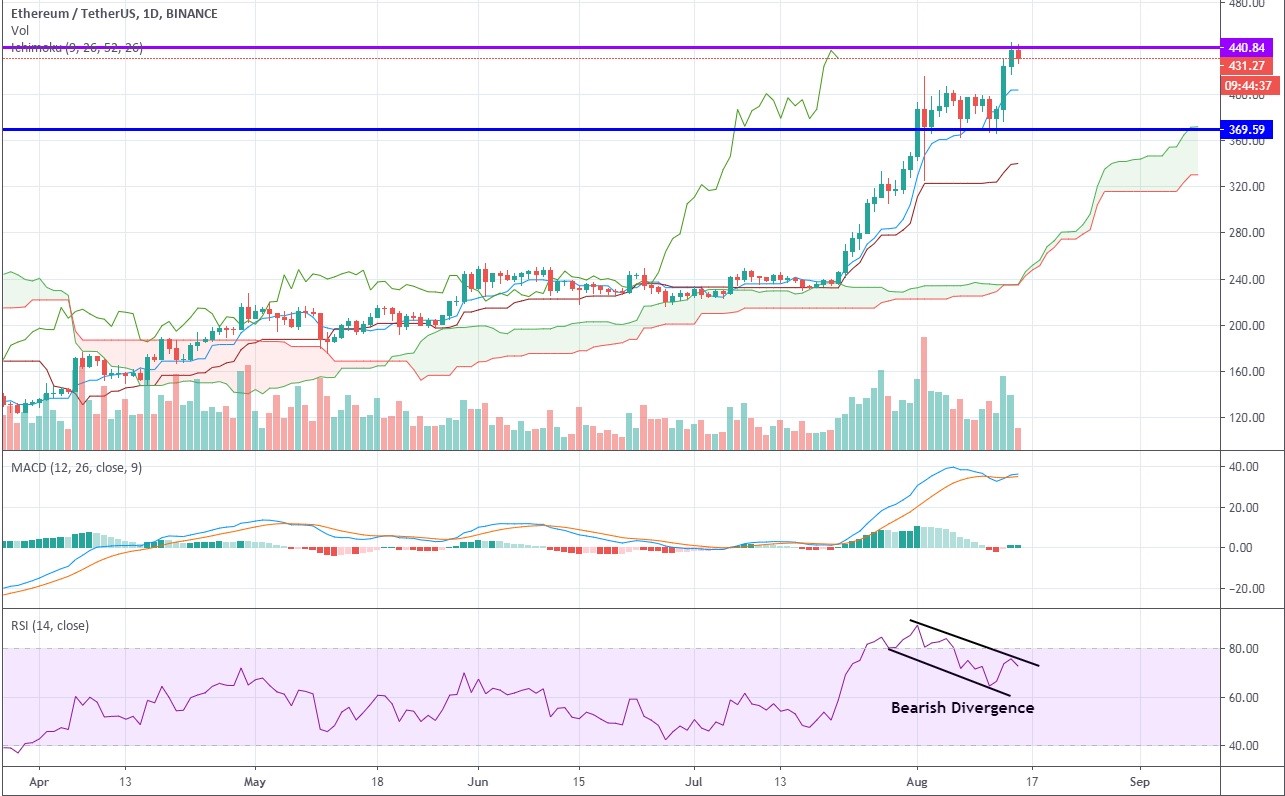
1-day ETH/USDT chart
- The Ichimoku Cloud indicator is clearly signaling that the market holds a significant bullish charge as the price is holding strongly above both base and conversion lines, while the growing green Kumo cloud suggests that the current support level is firm;
- MACD refused to go down after the bearish crossover as the main line went back above the signal one, but the indicator is already high in the overbought zone, so the probability of a drop of both the indicator and the price is high;
There is a very distinctive bearish divergence on RSI that points at the possibility of a deeper retracement, perhaps even to $369.
We reckon that in the present circumstances, only a major disaster could prevent Ethereum from pursuing the bullish course, although traders could see more activity on the part of the bears throughout this week.
Author: Alex Paulson for Crypto-Rating.com


Top Cryptocurrencies with Price Predictions
| # | Crypto | Prediction | Accuracy | CVIX | Price | 24h | 7d | Market Cap | 7d price change | |
| 1 | Bitcoin predictions | 82.8% | 26 | $63 056.05 | -2.01% | -1.43% | $1 241 617 970 138 | |||
|---|---|---|---|---|---|---|---|---|---|---|
| 2 | Ethereum predictions | 74.8% | 43 | $3 119.45 | -0.77% | 2.11% | $380 732 258 823 | |||
| 3 | Tether predictions | 92.8% | 1 | $0.999789 | -0.03% | -0.07% | $110 402 475 209 | |||
| 4 | Binance Coin predictions | 88% | 20 | $594.64 | -2.63% | 6.81% | $87 762 232 025 | |||
| 5 | Solana predictions | 65.6% | 70 | $136.60 | -4.85% | -4.07% | $61 080 463 429 | |||
| 6 | USD Coin predictions | 91.6% | 2 | $1.000057 | -0.03% | 0% | $33 466 186 839 | |||
| 7 | XRP predictions | 68.4% | 69 | $0.519561 | -1.55% | 1.09% | $28 698 401 022 | |||
| 8 | Dogecoin predictions | 67.6% | 68 | $0.146676 | -2.67% | -5.75% | $21 128 876 704 | |||
| 9 | Toncoin predictions | 68.4% | 65 | $5.34 | -0.48% | -11.99% | $18 526 876 536 | |||
| 10 | Cardano predictions | 61.2% | 81 | $0.459891 | -2.84% | -3.82% | $16 387 866 487 | |||
| 11 | SHIBA INU predictions | 62% | 82 | $0.000025 | -2.66% | 8.35% | $14 733 217 162 | |||
| 12 | Avalanche predictions | 63.2% | 78 | $34.18 | -3.85% | -2.73% | $12 928 457 786 | |||
| 13 | Wrapped TRON predictions | 84.8% | 18 | $0.119251 | 1.62% | 8.52% | $10 441 972 429 | |||
| 14 | TRON predictions | 88.4% | 21 | $0.119090 | 1.15% | 8.58% | $10 427 951 829 | |||
| 15 | Lido stETH predictions | 94% | 1 | $2 941.39 | -0.40% | -3.32% | $10 258 752 564 |