


The Best Altcoins to Have in Your Cryptocurrency Portfolio in 2023
While Bitcoin retains the status of digital gold, a titbit for institutional investors and the most talked-about cryptocurrency, there are plenty of altcoins that deserve to be in every smart trader’s portfolio. Especially in 2021, when the bull market continues to mature, and a lot of altcoins will go on a price discovery after beating the respective all-time highs. For that reason, we have decided to compile a list of the finest alternative coins that will become the crown jewels of your crypto portfolio.
Ethereum (ETH)
Some might say that adding Ethereum (ETH) to the cryptocurrency portfolio in 2021 is the choice that Captain Obvious would make. There is no point in hiding the truth - we reckon that ETH should make for a significant part of anyone’s portfolio, perhaps even larger than the one devoted to Bitcoin (BTC). The reasoning behind that is simple and pragmatic: over the past twelve months, ETH has been consistently displaying much better gains than BTC while maintaining a close correlation with the rival’s price action.
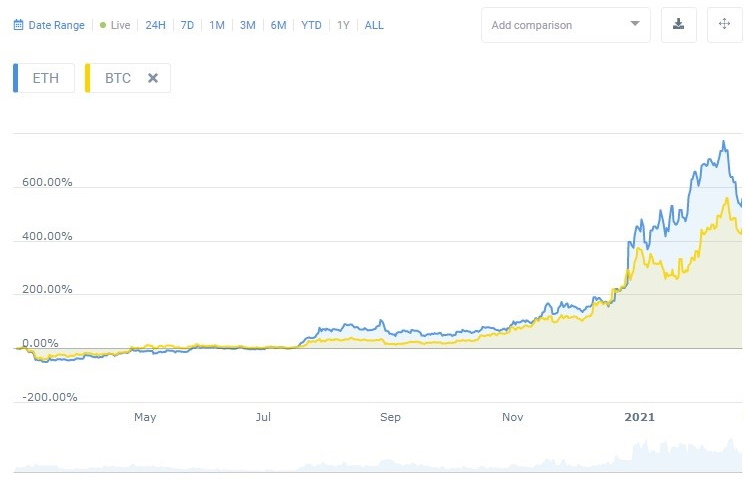
ETH/BTC comparison chart. Source: CoinCodex
You can clearly see that when the price of the altcoin had penetrated the $2,000 level and established the current all-time high at $2,044 (on Binance), Ethereum’s gains over the past year reached 772% at the peak of the rally while Bitcoin barely managed to climb above 500%.
Should the bull market persist, BTC will surely remain in the center of attention and add a couple of hundred percent to the upside, but ETH is likely to remain a better profit generator because its bull run is instigated by a crucial fundamental factor, namely the recent launch of the first stage of Ethereum 2.0, also dubbed Eth2 or Serenity, a massive upgrade to the Ethereum blockchain that is bound to resolve the major issues with network speed, transaction fees, and a burning problem of scalability that is seriously halting the development of the entire decentralized finance (DeFi) sector that is built on the Ethereum blockchain.
But it’s the transition to the Proof-of-Stake (PoS) consensus mechanism that constitutes the most crucial part of the entire endeavor and the most challenging for that matter. The switch to PoS will make the whole ecosystem more energy-efficient, contrary to the electricity-hungry Proof-of-Work, and eliminate the need for purchasing expensive hardware, like premium graphics cards, to mine the coins. With PoS, the system will be sustained by the pool of validators who are responsible for verifying transactions and creating blocks. A potential validator must stake at least 32 ETH in order to be eligible for running the node - the increasing number of nodes will contribute to an even greater decentralization of the network and better support of shard chains, another key component of Ethereum 2.
On December 1, the Ethereum Foundation had initiated the first phase of Eth2 with the launch of Beacon Chain, a special coordination mechanism that is crucial for the generation of new blocks, along with the staking, which by the time of launch had already attracted more than 2 million ETH ($1.5 billion) to the deposit contract and got 2% of the total supply of ETH locked there. This event served as a major catalyst for a 246% rally that Ethereum had before a 36% correction took place.
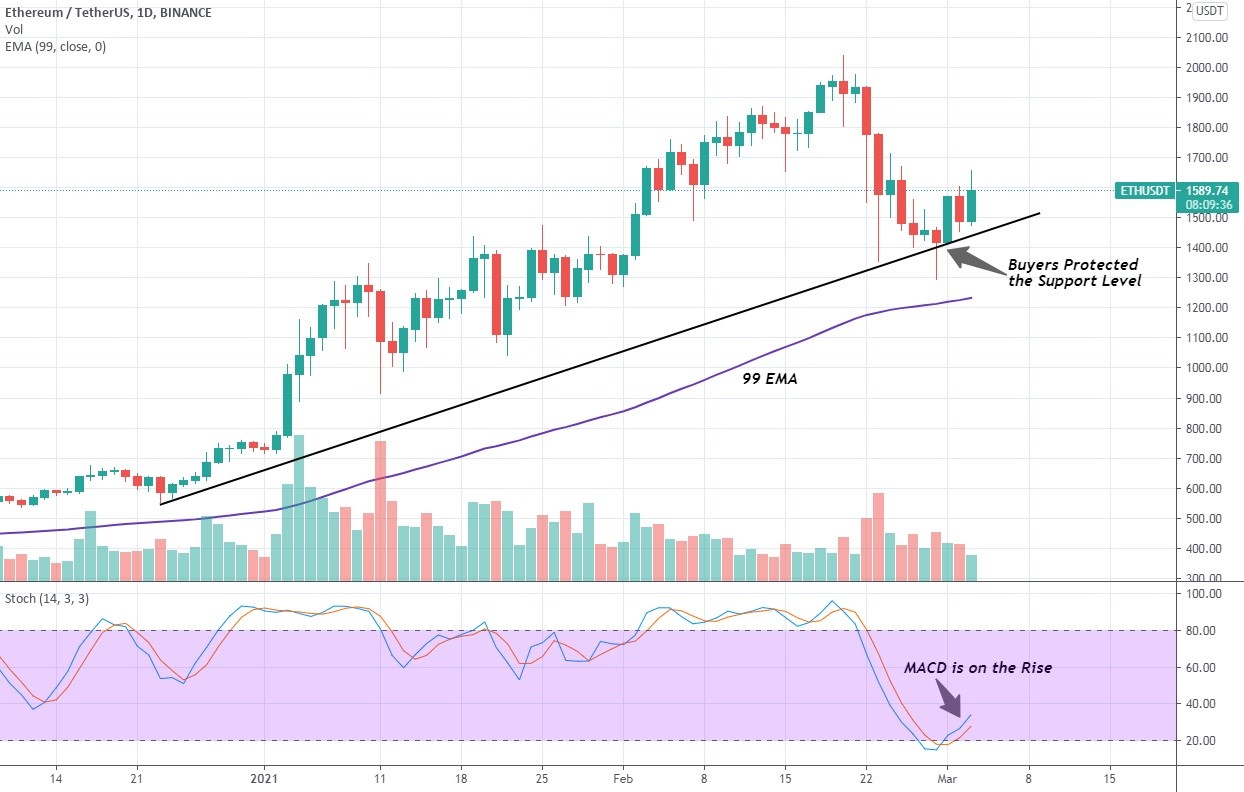
1-day ETH/USDT chart. Source: Tradingview
The daily chart above demonstrates the correction phase is close to being over as the price has rebounded off the diagonal support line after coming close to testing the 99 EMA. At the same time, the MACD indicator began to rise from the oversold zone, which points to the possibility that the momentum has already shifted in the bulls’ favor. However, the bearish trading volume still prevails over the bullish one at this junction, so the retest of the support or even the 99 EMA remains a possibility. Nevertheless, the probability of ETH continuing the rally to new ATHs in the undiscovered territories is very high for 2021.
Our proprietary price prediction algorithm that utilizes the Crypto Volatility Index (CVIX) suggests that over the course of 2021, the price of Ethereum will change in the following way.
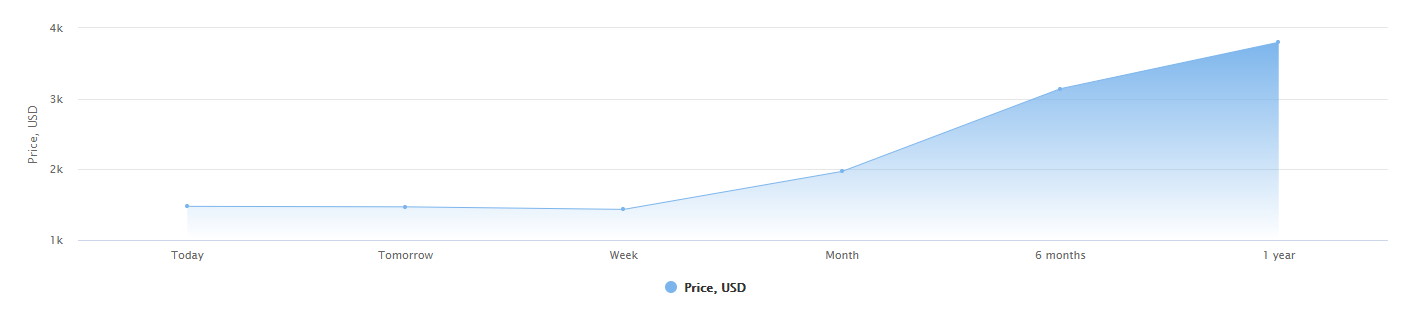
1-year Ethereum price prediction chart
The algo shows that in 30 days, the value of ETH will rise by 54.2% from the current $1600 to $2400, whereas at the end of the year, traders will see the second altcoin up by 160% and settling at the price level of $4100. Needless to say that with such a profit projection should persuade anyone to devote a substantial chunk of the portfolio to Ethereum.
Cardano (ADA)
It’s our firm belief that Cardano (ADA) is destined to become the best altcoin to buy and hold in your portfolio in 2021 and beyond because hardly any coin has displayed such tremendous progress in improving the underlying fundamentals that resulted in an unprecedented price appreciation during the past year. Over that period of time, ADA gained the mind-boggling 2500% against USD while also breaking away from Bitcoin and Ethereum by 340% and 260%, respectively.
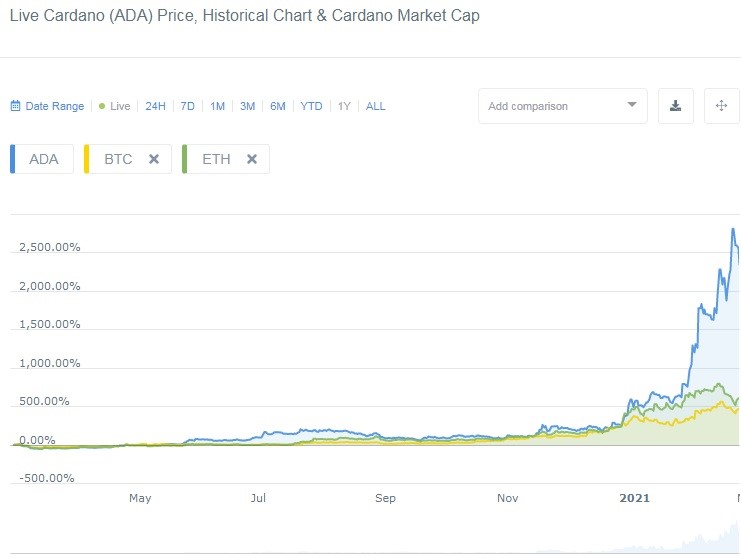
ADA/BTC/ETH comparison chart
And if there is an “Ethereum killer” among the myriad of altcoin, ADA is surely the one that has the proper ammunition and the capability to push ETH off its pedestal. The coin has already made a huge advance in the global rankings by rising from the position below the top 10 to the number 3 spot on Coinmarketcap as its market capitalization skyrocketed to $40 billion on the back of a crazy price appreciation.
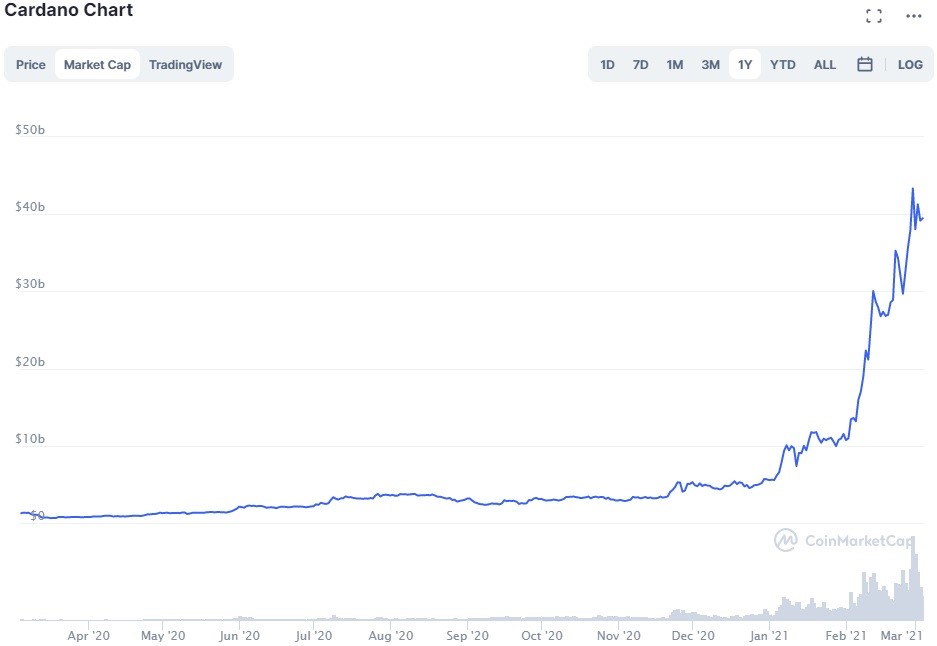
Cardano market cap chart. Source: Coinmarketcap
Cardano still has a long way to go before it could bother Ethereum that lies on its laurels of the best altcoin by market capitalization that amounts to $185 billion, as of the time of writing, which is almost five-fold larger than that of ADA, whose position is threatened by Binance Coin (BNB), Tether (USD), and Polkadot (DOT), all of which have roughly the same market cap.
Therefore, the year 2021 will be crucial for Cardano in terms of its entrenchment in the top 5, but the altcoin should pass this test in flying colors because hardly any team has been working so tirelessly on improving the blockchain ecosystem and incorporating new features than the Zug-based Cardano Foundation.
Things began turning extremely bullish for ADA last July after the team had carried out a successfully hardfork upgrade called Shelley that introduced staking way ahead of the rivaling Ethereum and provided a solid foundation for the rally that followed. A few days ago, the Cardano network had another hard fork named Mary that transformed its blockchain into a multi-asset chain that offers means for the issuance of native tokens and also opened up the pathway to the next major update called Goguen that will introduce the instruments for building decentralized applications (dApps) along with smart contracts, all of which will really put Cardano on the level with Ethereum or even higher and help the altcoin solidify its position in top 5.
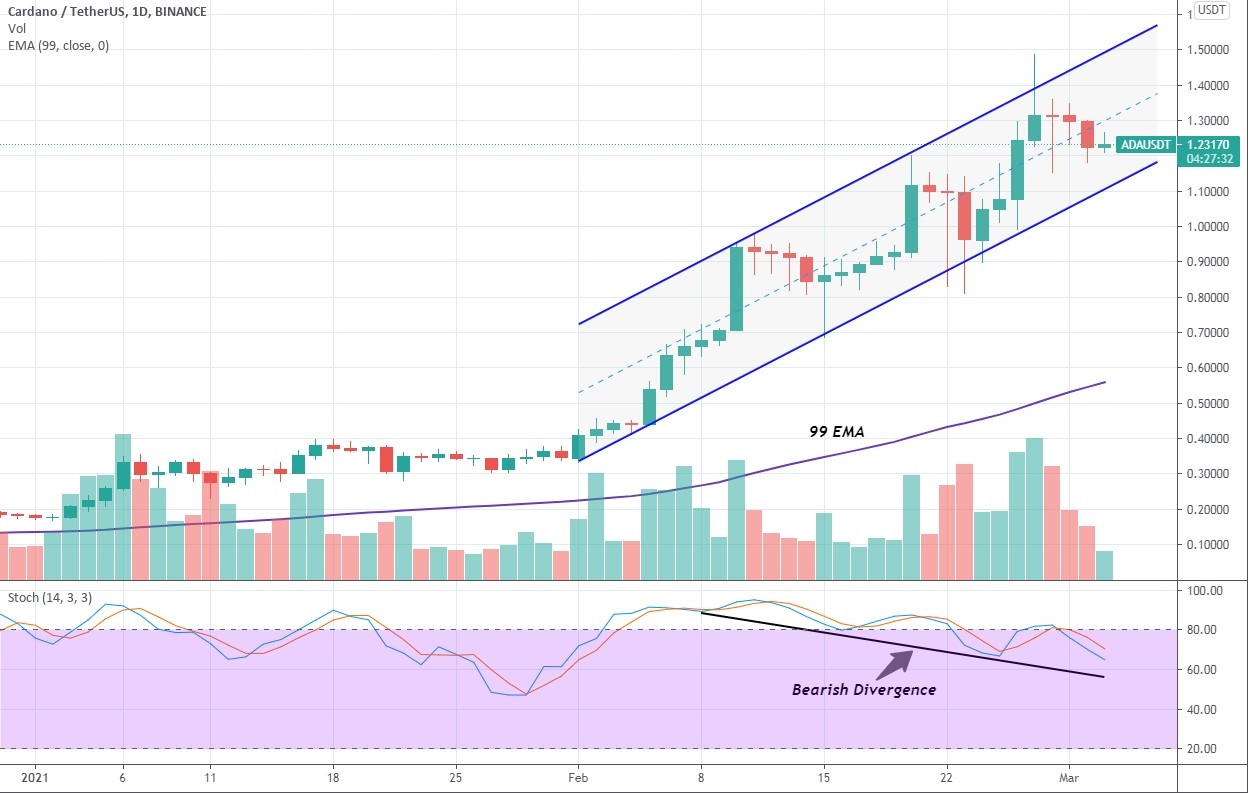
1-day ADA/USDT chart
The daily chart demonstrates that ADA maintains a strong uptrend as it moves inside the perfect uprising channel while remaining at a considerable distance from the 99 EMA. However, pay close attention to the bearish divergence displayed by MACD, accompanied by the decreasing trading volume, which could be the sign of a deeper correction ahead, though the most likely short-term ADA prediction is that the price would bounce off the support at $1.16 and continue chugging to the upside.
But even though Cardano’s price could face a short decline, it will certainly stay on the bullish side for the remainder of 2021, as our price prediction chart shows.
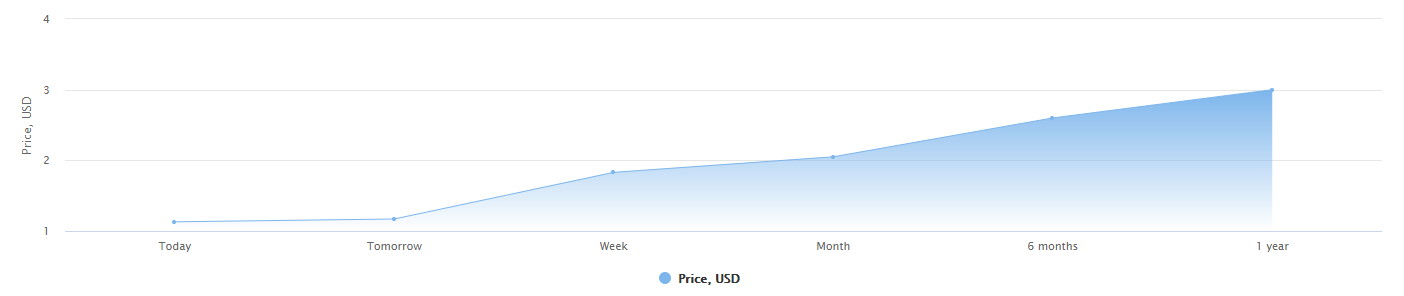
1-year ADA prediction chart
Our algorithm forecasts that in as little as 30 days, ADA will have another 85% price boost and land at the price level of $2.3. By the close of the year, Cardano will take out another crucial price level at $3 and establish a foothold at $3.3. Therefore, even if you missed the opportunity to stack up on ADA when the bull market was just taking shape, adding it to the 2021 portfolio would still reap triple-digit profits even if you plan on simply holding it throughout the entire time.
Polkadot (DOT)
Polkadot (DOT) became a genuine crypto superstar in 2020 when it was officially rolled out, though the altcoin and the underlying blockchain ecosystem had been in development since 2016. The coin emerged on the market last September and had taken an ambiguous position until its market capitalization was revealed, upon which DOT began a confident rise to the top of the global ranks and new all-time highs.
At the time of writing, Polkadot sits in the 6th spot, with the market capitalization of $34 billion and the price of $37.2 per coin, which has risen by 127% against USD over the past month and also saw a 51% upside swing in the BTC market and outperformed ETH by 89.3%. Its value has increased by a staggering 2085% since DOT got listed on major cryptocurrency exchange platforms.
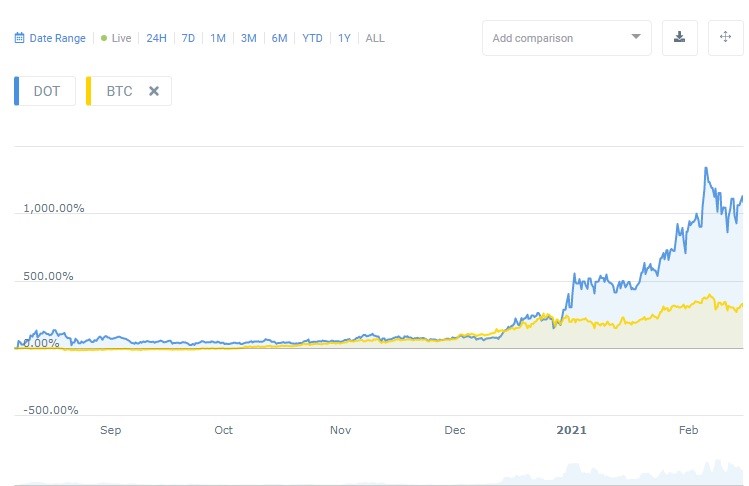
DOT/BTC comparison chart
A glance at the comparison chart above would be enough to recognize the fact that Polkadot has been a far better gainer than Bitcoin, even though the first cryptocurrency also had a massive rally. There is no question in our minds that if you want to diversify your crypto portfolio with altcoins with extraordinarily good fundamentals and explosive price action, Polkadot should definitely become a part of it.
One of the reasons why DOT became a hit straight away is because it has an amazing team of developers led by Gavin Wood, a legend in the blockchain space who is known for creating the programming language for smart contract called Solidity that became the foundation for smart contracts that run on the Ethereum Virtual Machine (EVM), for which Wood had written the Yellow Paper. Polkadot’s other founders are Peter Czaban and Robert Habermeier, the well-established names in the cryptocurrency industry.
When it comes to fundamentals, Polkadot offers a unique solution that is based on the utilization of two blockchains: the relay chain that acts as a mainnet, where all transactions take place, and a large number of parachains created by network users. This network structure will allow for swifter and more private transactions while keeping the user data away from the public network.
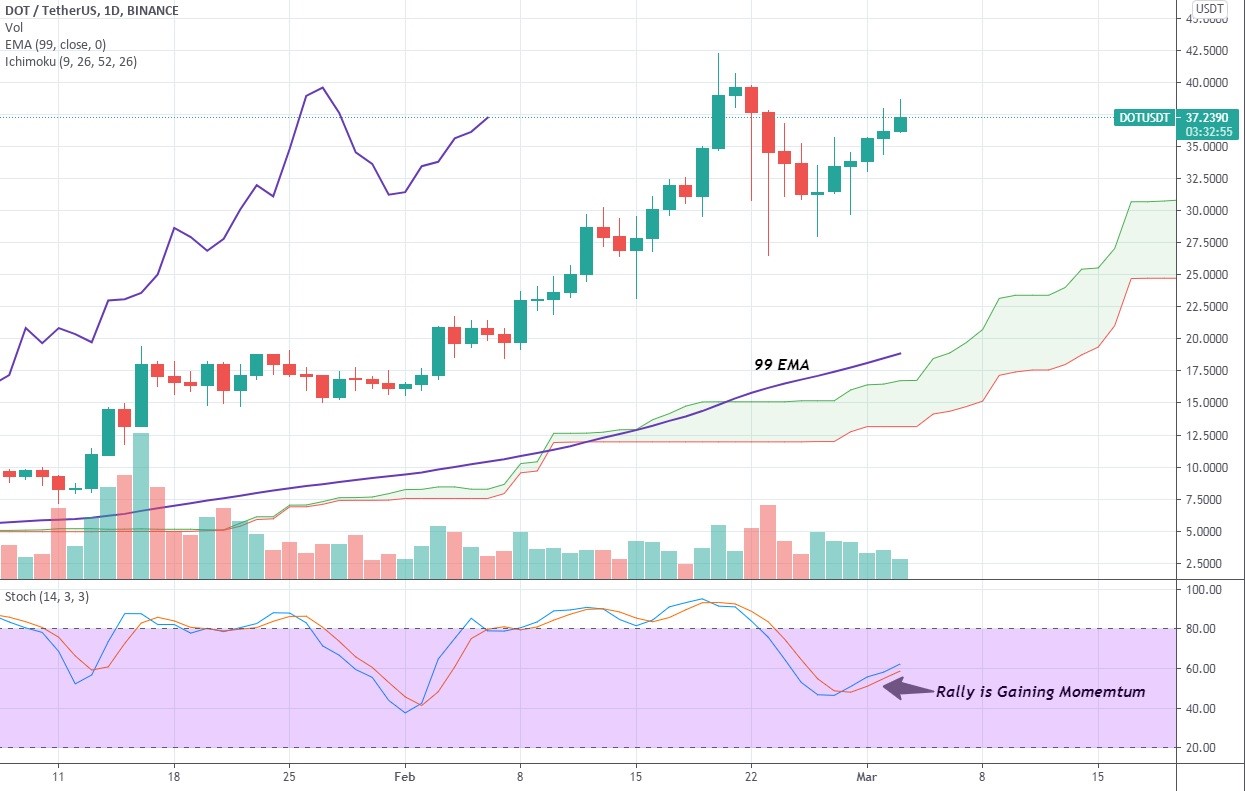
1-day DOT/USDT chart
The daily chart shows how well DOT has recovered after quite a deep 37% correction after the buyers defended the support at $30 without much hassle so that the price didn’t even come close to the trend-setting 99 EMA and the Kumo Cloud before reversing to the upside. MACD has also reversed northward and provided an additional confirmation that the retracement had run its course.
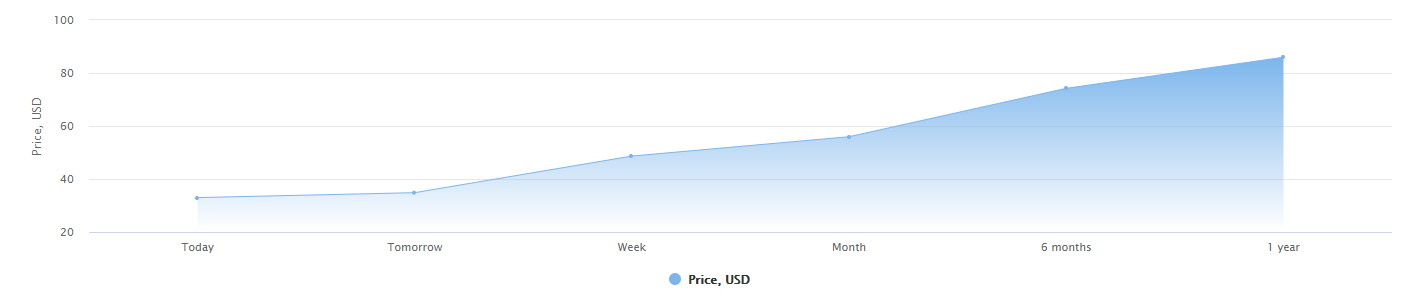
1-year DOT prediction chart
Our price prediction chart conforms with the bullish expectations as it shows DOT to be on the verge of yet another rally that promises to take the price up by 77.6% in a month, whereas at the end of the year, cryptocurrency traders will see the price approaching a huge psychological level at $100. All in all, Polkadot is a killer combination of superior fundamentals and increased demand from traders and developers alike, which is a must-have for any crypto investor who isn’t focused solely on Bitcoin.
Chainlink (LINK)
Speaking of altcoin rockstars, Chainlink (LINK) would have formed a crushing band together with Polkadot and Cardano because after the market meltdown of March 2020, it has been rallying almost ceaselessly. The altcoin went from being priced just under $2 last spring to hitting the all-time high at $36.75 on February 21, upon which LINK retraced by as much as 44% and even scared traders and investors after having penetrated the 50-day EMA while the majority of other top altcoins remained above that moving average.
Nevertheless, LINK had an absolutely stunning performance last year, rivaled only by Ethereum that fell behind the altcoin under review only by a mere 4%, whereas Bitcoin's underperformance amounted to 26%. But when it comes to the USD market, LINK has been kicking a** and taking names as it rallied by 630% over the past twelve months. Given that the bull market is likely to continue throughout 2021, LINK's rally will kick into gears once again after the market confirms full recovery from the recent selling pressure.
Just like most alts included in this list, Chainlink represents the ultimate combination of technological advancements and hot price action with the capacity for making dozen percent moves to the upside in a short period of time. LINK represents a decentralized oracle solution that serves as a middleware for the blockchain smart contracts and real-world data. In other words, if one wants to receive verified data from off-chain sources (it could be anything from interest rates to the outcome of games) and incorporate it into the blockchain and its smart contracts, he would need to bridge the gap between them with the help of LINK's oracles. There are several other oracle solutions out there but, in all candor, Chainlink's is the most efficient and well-adopted. If you are interested in digging deeper into LINK's fundamental value and how it will affect the price in the years to come, take a minute to read this LINK 2025 prediction article.
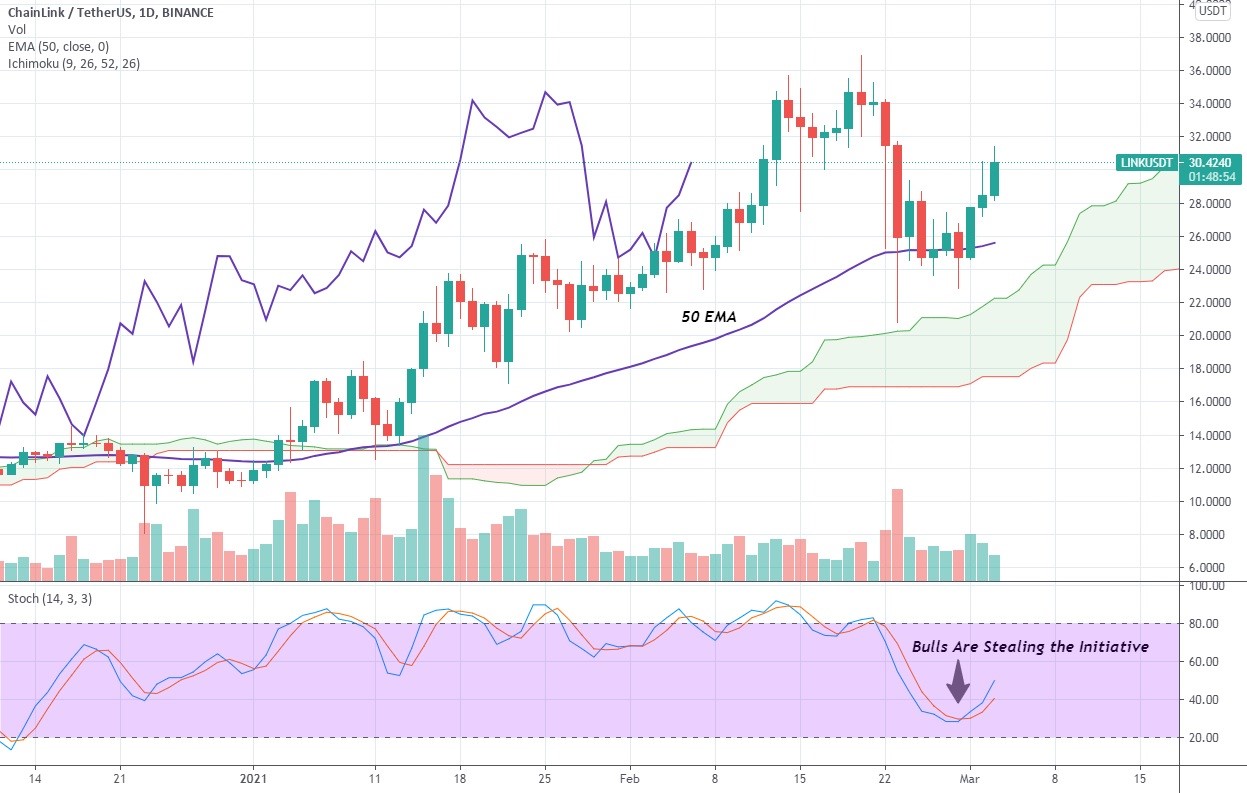
1-day LINK/USDT chart
On the daily time frame, Chainlink appears to have been able to maintain the uptrend structure after consolidating near $26, but the price still needs to go above $37 in order to confirm the uptrend continuation. But it appears that the bulls are stealing the initiative, as MACD shows us, while the Ichimoku Cloud indicator also appears to have the bullish bias.
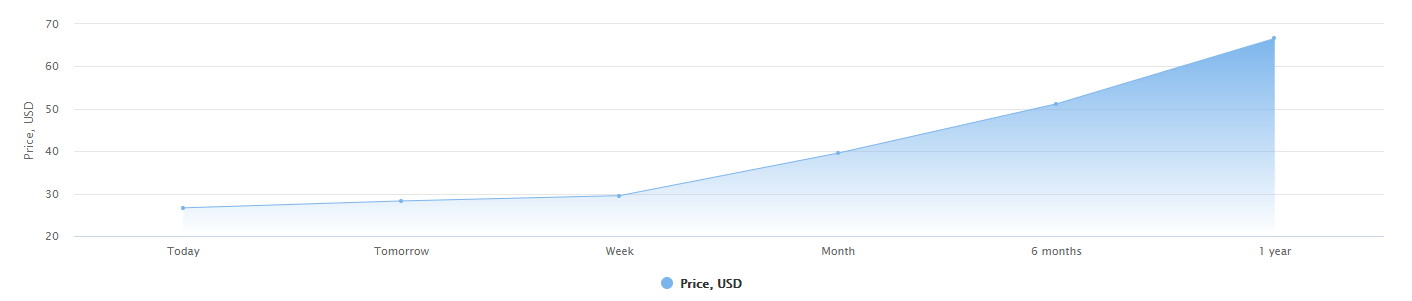
1-year LINK price prediction chart
Our price prediction algorithm has it that LINK is going to keep swinging to the upside in 2021 and break the important price level at $50 in about five months' time. Chainlink will go up by another 158% by year's end and hit the ceiling at the price level close to $80. We've said it before that LINK holds immense potential, so not having this altcoin in your portfolio in 2021 could be a regrettable mistake.
Theta Token (THETA)
Truth be told, Theta Token (THETA) is one of the author’s favorite altcoins from outside the top 10 for one simple reason - it is an amazing performer and one of the best gainers around. Get this, during the past twelve months, THETA’s value in USD has increased by as many as 3,200%, the result that would invoke jealousy even in most DeFi coins. Obviously, we don’t even have to provide the comparison chart because the numbers speak for themselves. But if you are interested, THETA has already outperformed BTC by 468% and beaten ETH by 369%.

1-year THETA price chart. Source: Coinmarketcap
Above, you can see the beauty of a price chart that depicts how well the maturation of this particular market has been going: an explosion to $2, followed by a prolonged consolidation and the subsequent eruption to the upside. No silly pumps and dumps - just a good old uptrend that is set to persist for the entire 2021.
Out of the entire cohort of super hard-gainers, most of which belong to the DeFi sector, Theta Token has a somewhat unique fundamental value because it represents a blockchain-enabled streaming platform that is conceptually similar to Twitch. In addition, the platform enables users to engage in the P2P sharing of computing power and bandwidth. Basically, it’s the answer to the overly centralized streaming platforms like YouTube Gaming, Twitch, Vimeo Live that exercise censorship, unjustified bans, and are prone to security breaches. It’s obvious from THETA’s astronomical rally that there is a high demand for such a solution, which is likely to increase in 2021 as more people get to realize the benefits of this decentralized streaming platform.
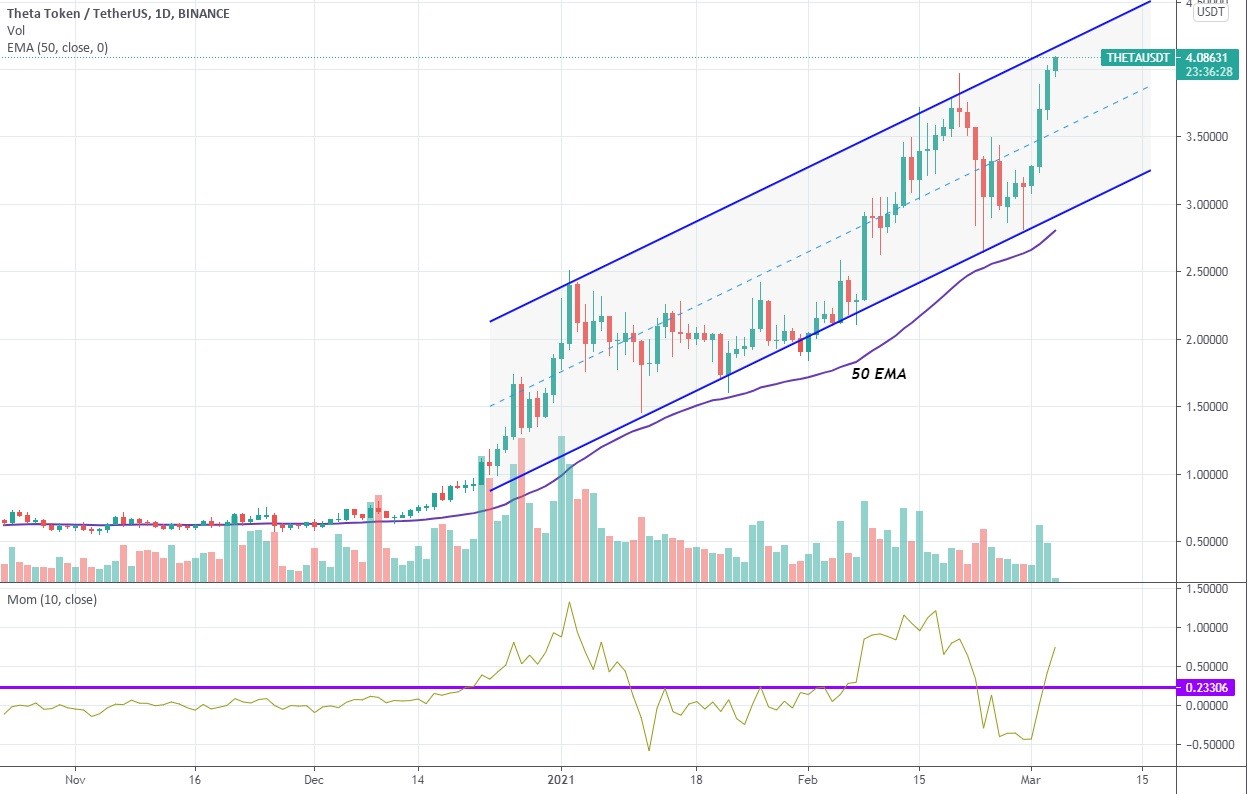
1-day THETA/USDT chart
The price has been showing the utmost respect to the 50-day EMA even since it broke into an uptrend last December. Similarly to Cardano (ADA), THETA has been moving inside a neat uprising channel, though it appears that the buyers are eager to break it to the upside soon enough, the intention that is confirmed by the Momentum indicator that has risen sharply from lower extremities and broken the resistance at 0.23, which signifies that the bulls are in the driving seat at the moment.
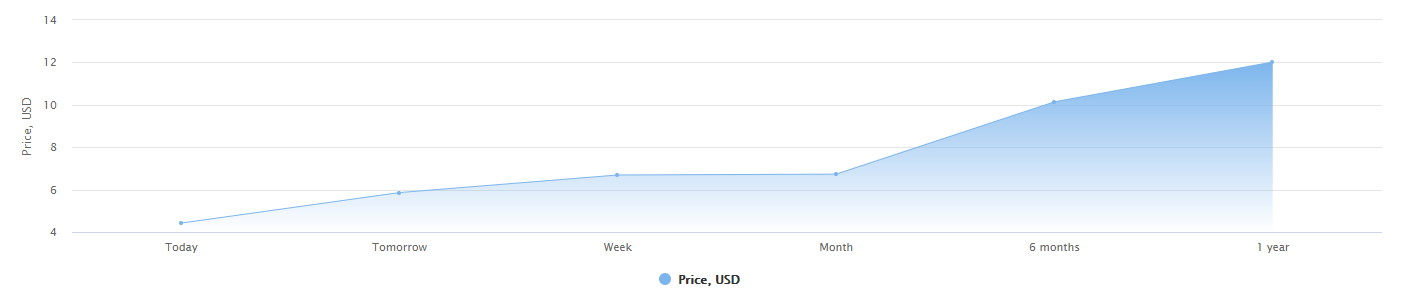
1-year THETA price prediction chart
But before rushing to buy THETA and adding it to the portfolio of best altcoins for 2021, take a look at our THETA price prediction chart above, which warns that over the next 30 days, the price is likely to have a mild correction, but there is also a high possibility that it would shoot to $6 before that happens. However, this year has a lot of bullish action in store for THETA because, by its close, the price will soar by another 171% and land just above $10.
Aave (AAVE)
We have finally arrived at the destination called decentralized finance (DeFi), the financial movement that has taken the crypto world by storm. In short, it’s a totally innovative form of finance that eliminates the necessity for third-party services like banks, brokerages, and exchanges. The history of DeFi projects dates back to 2017, but they had been flying under the radar until the middle of 2020 when the total value locked (TVL) in this industry began to rise like a space shuttle from around $500 million distributed across all projects to the current $40.4 billion, though this value has peaked in February at $45.1 billion.
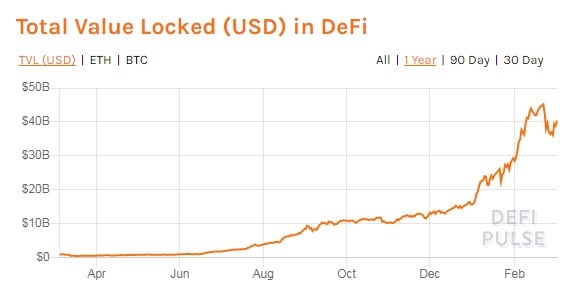
1-year DeFi TVL chart. Source: DeFi Pulse
Aave (AAVE) is a lending project that accommodates $5 billion out of that handsome TVL. The altcoin with the ticker AAVE emerged on the crypto scene last September, but before that, it went by the ticker LEND, a coin that was among the absolute record-breakers in terms of gains. In a year before LEND migrated to the new AAVE blockchain - at a rate of 100 LEND per 1 AAVE - the former enjoyed the price appreciation of 14,900% against USD, 2,500% against Bitcoin, and 2,000% when traded against Ethereum.
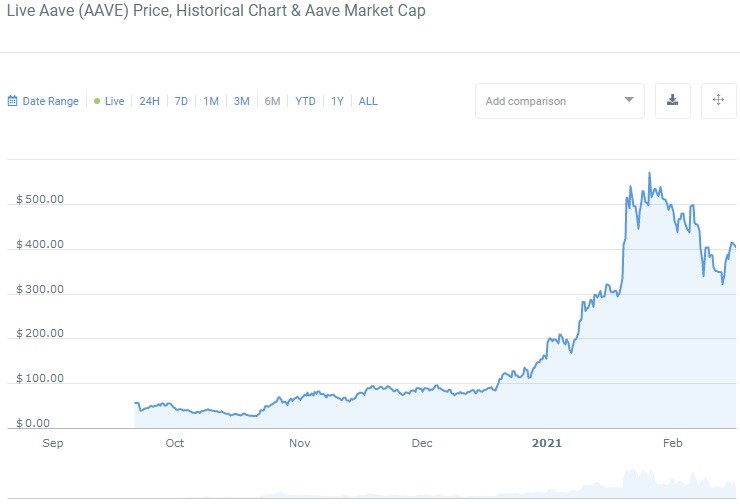
1-year AAVE price chart. Source: CoinCodex
AAVE’s performance has been a bit more “modest” as the altcoin went up by 1260% in the past six months and 350% over the past ninety days. And after the last correction is being dealt with by the buyers, the DeFi coin is likely to proceed on its way to the upside because this sector is developing in leaps and bounds, while AAVE represents one of the best-funded projects.
As for its fundamental value, Aave is a lending platform that provides means for lenders to earn interest by contributing to the liquidity pools. The borrowers, on the other hand, can use their crypto capital as collateral for a flash loan taken from one of the pools. The token itself has a governance function and provides some perks for platform users.
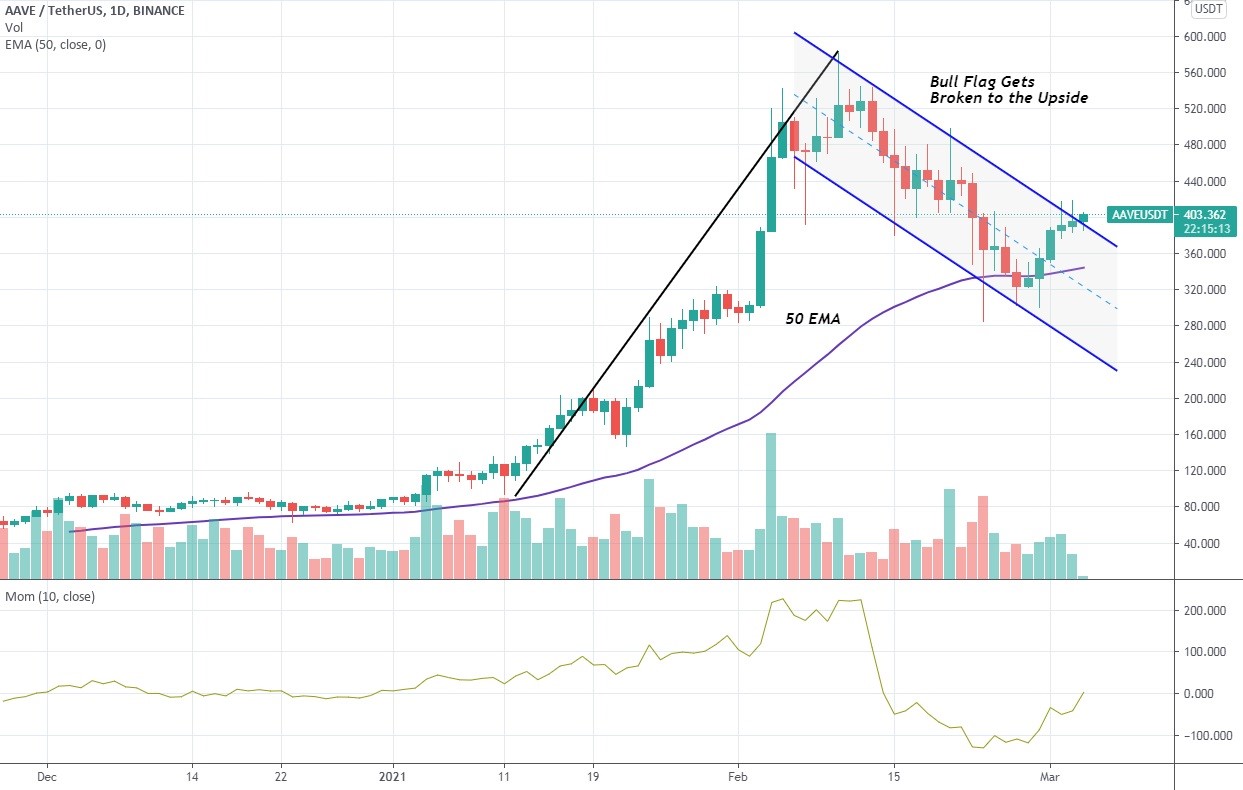
1-day AAVE/USDT chart
The chart analysis tells us that Aave is initiating a breakout from the bullish flag that signifies the likelihood of uptrend continuation. We also notice the sequence of five days of buying volume of mild intensity with the tendency to rise, accompanied by the soaring Momentum indicator that reversed to the upside. All these factors point at an imminent break to the $500 area, so if you are planning on adding AAVE to your portfolio, now would be the ripe time to do it. Our algorithm sees that by the end of 2021, AAVE will see another 170% being added to its value, while the price action will take place around the $900 region.
Cosmos (ATOM)
If you have become a part of the crypto world not so much for the purpose of speculation on price swings to make enough money to buy a Lambo, but to support the development of projects that strive to resolve the issues that plague the entire industry, such as the electricity gluttony of PoW and the resulting environmental damage, the insufficient speed of transactions and their high cost, and the hardest of all - the scalability of most blockchains, then Cosmos (ATOM) is where a part of your crypto portfolio needs to be.
The Cosmos ecosystem stems from Tendermint, a platform for building tools for distributed networks, which became the foundation for the Cosmos Hub, the project’s main blockchain that incorporates ATOM tokens to facilitate governance.
The importance of Cosmos’s mission, so to speak, can be compared to that of Chainlink as both are working on unifying the entire blockchain universe and connecting it with the real world, though, as already mentioned, Cosmos is focused on the issues of scalability, interoperability, and easiness of dApp building through the use of modularity method. Without diving further into technicalities, Cosmos has a noble mission and solid fundamentals, so ATOM would be a great altcoin to have in your portfolio in 2021 and beyond, especially given that it’s about to complete only the first stage of what seems to be a sustainable bull market, so ATOM remains somewhat underpriced, compared to the large part of promising altcoins.
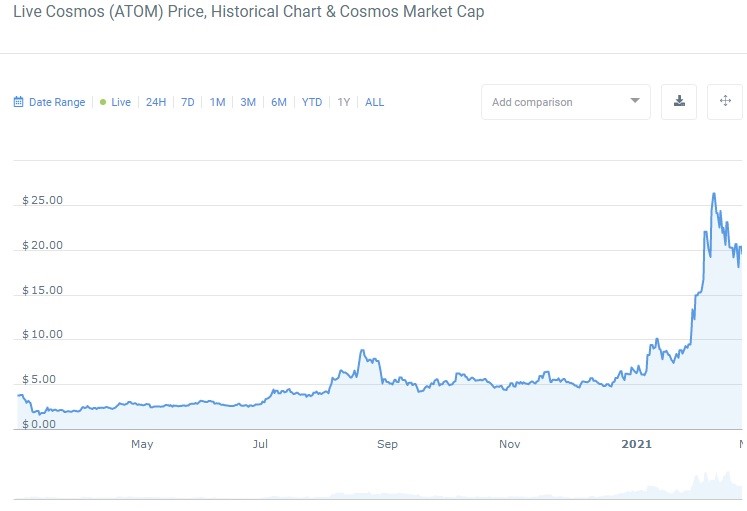
1-year ATOM price chart
ATOM has recently hit its first all-time high of this bull market at $26.32 but then immediately got caught in a 43% correction, though the buyers managed to keep the price above the 50-day EMA and defend the support level at $16.

1-day ATOM/USDT chart
We also see how the resolution of the bullish flag pattern unfolds. But in contrast to the situation in the AAVE market, here the momentum is yet to move in the bears’ direction completely, as the MACD indicator shows. Therefore, beware that the initial breakout of the bullish flag might still result in the retest of the price level at $18 and some consolidation. For that reason, we advise exercising caution and patience before adding ATOM to your portfolio because there is a good chance that you could buy it at a discount before the price rips up to a new all-time high. Our algorithm suggests that by the end of 2021, the price of ATOM will be hovering above the $50 level as the result of a substantial price appreciation.
The Sandbox (SAND)
Lastly, let's say that you are looking for ways to diversify your cryptocurrency portfolio before the bull market of 2021 continues after the correction, and not with some "boring" altcoins that deal with global technological problems, but with something unusual and fun. If that's the case, we suggest that you check out The Sandbox (SAND), a utility token that backs an absolutely amazing decentralized gaming platform that offers an interesting concept of "play and earn" that combines virtual creativity aka Minecraft, the purchase of virtual land, the creation of non-fungible tokens (NFTs), and the configuration of new gaming experiences. The project had actually carried out the sale of the land situated in the virtual world, which is called metaverse.
The platform has three key components: an art animation software called Voxedit 3D that creates NFT tokens; a proprietary marketplace where these tokens can be easily sold and purchased, and a unique Game Maker tool that opens broad possibilities for developing and engaging in gaming experiences in the said metaverse.
The most appealing thing about The Sandbox is, of course, the non-fungible tokens. In case you don't know, the NFTs are deemed as the next big thing that will come after the DeFi mania wears off. Even now, these tokens that contain unique digital data are being sold for huge sums. For instance, the Canadian singer Grimes, who happens to be in a relationship with Elon Musk, has recently sold a collection of digital art of her own making, the ownership of which was transferred through NFTs, for $6 million. Surely, there is no correlation between The Sandbox and that particular sale, but the prospects of the NFT market are clear. And since SAND fuels the blockchain platform that aims to become the marketplace for such tokens, the demand could be more than for the ice on a hot day. Needless to say that such a demand would take the price of SAND to a whole new level in 2021.
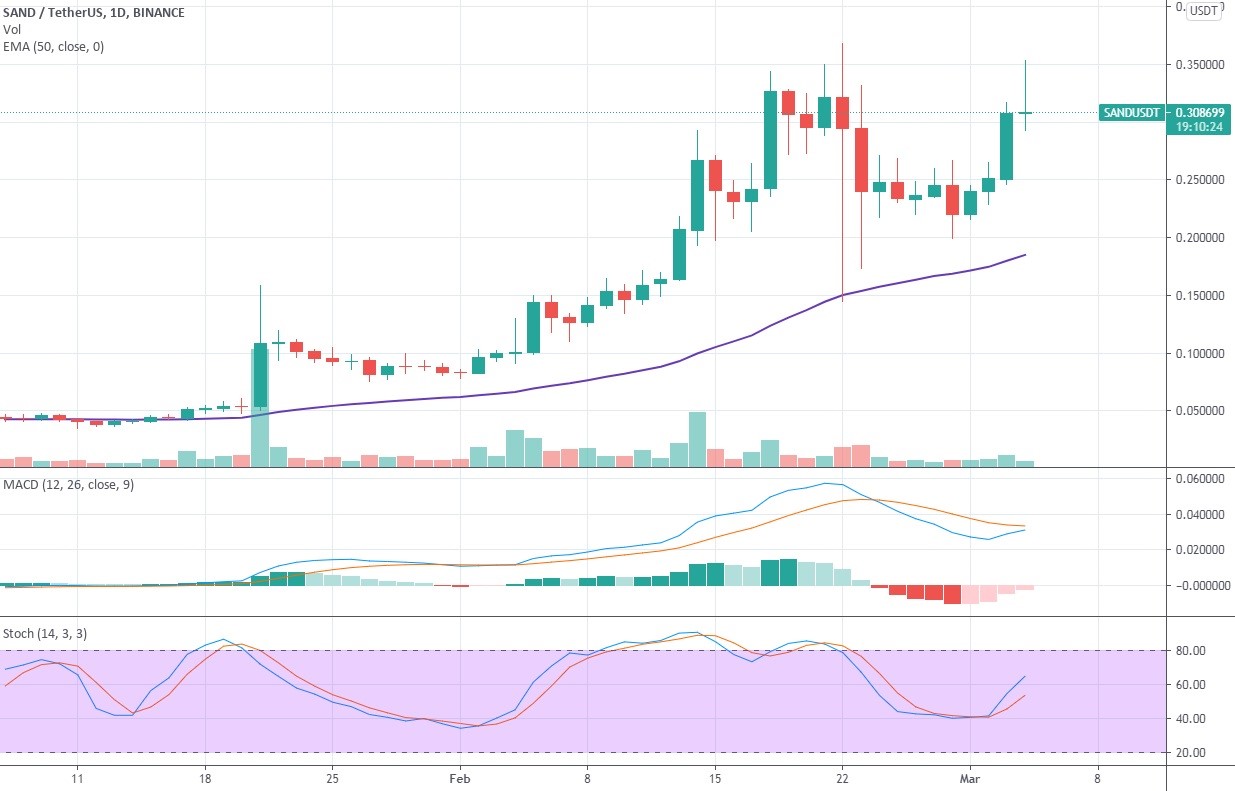
1-day SAND/USDT chart
The situation on the daily chart looks very promising for SAND as it had successfully recovered after a steep correction and has already tested the previous all-time high at $0.36. The Stochastic indicator is very bullish here, while MACD appears to be ending its bearish phase. Breaking the ATH will send the price into uncharted waters where it can easily travel to $1 over the next six to eight months and end the year near the support level at $1.2.
Author: Alex Paulson for Crypto-Rating.com


Top Cryptocurrencies with Price Predictions
| # | Crypto | Prediction | Accuracy | CVIX | Price | 24h | 7d | Market Cap | 7d price change | |
| 1 | Bitcoin predictions | 84.4% | 21 | $63 006.70 | -4.70% | -10.99% | $1 240 234 985 615 | |||
|---|---|---|---|---|---|---|---|---|---|---|
| 2 | Ethereum predictions | 79.6% | 31 | $3 075.91 | -4.93% | -15.36% | $369 325 651 340 | |||
| 3 | Tether predictions | 94% | 1 | $1.000274 | -0.06% | 0.02% | $107 757 551 717 | |||
| 4 | Binance Coin predictions | 85.6% | 16 | $540.89 | -6.70% | -7.49% | $80 881 075 890 | |||
| 5 | Solana predictions | 77.6% | 41 | $133.59 | -11.56% | -24.12% | $59 661 965 013 | |||
| 6 | USD Coin predictions | 92.8% | 2 | $1.000093 | 0.01% | 0% | $32 543 863 561 | |||
| 7 | XRP predictions | 78.8% | 31 | $0.488558 | -4.73% | -22.64% | $26 929 290 292 | |||
| 8 | Dogecoin predictions | 72.4% | 60 | $0.154973 | -4.86% | -20.91% | $22 301 873 117 | |||
| 9 | Toncoin predictions | 70% | 53 | $6.21 | -12.05% | -7.96% | $21 568 185 642 | |||
| 10 | Cardano predictions | 76.8% | 49 | $0.459323 | -5.83% | -26.24% | $16 358 989 534 | |||
| 11 | SHIBA INU predictions | 57.6% | 85 | $0.000023 | -3.41% | -20.70% | $13 264 656 463 | |||
| 12 | Avalanche predictions | 66.4% | 63 | $34.43 | -9.57% | -29.04% | $13 011 159 055 | |||
| 13 | Lido stETH predictions | 96% | 1 | $2 941.39 | -0.40% | -3.32% | $10 258 752 564 | |||
| 14 | Wrapped Bitcoin predictions | 86.4% | 21 | $63 077.41 | -4.62% | -10.91% | $9 793 905 160 | |||
| 15 | Wrapped TRON predictions | 91.2% | 13 | $0.110786 | -3.01% | -9.37% | $9 708 229 432 |