


TomoChain (TOMO) Enters a Crucial Period of Price Action
TomoChain (TOMO) used the recent market crisis to initiate perhaps one of its strongest bull rallies since 2018. In just 105 days, TOMO had fully recovered after a huge price dump in March and then went on to gain 35% more, while the total price appreciation throughout the said period amounted to 175%. In doing so, the price has visited the zone of active interaction between $0.5 and $0.7. It signifies that TOMO is entering the period of intense opposition between the bulls and the bears that might result in a prolonged ranging, and a subsequent sharp rise or drop of TOMO price, depending on the market conditions.
TomoChain struggles with the multi-month resistance level
To understand the situation in the TOMO/USDT market better, let’s first take a look at the weekly time frame that holds a lot of crucial information.
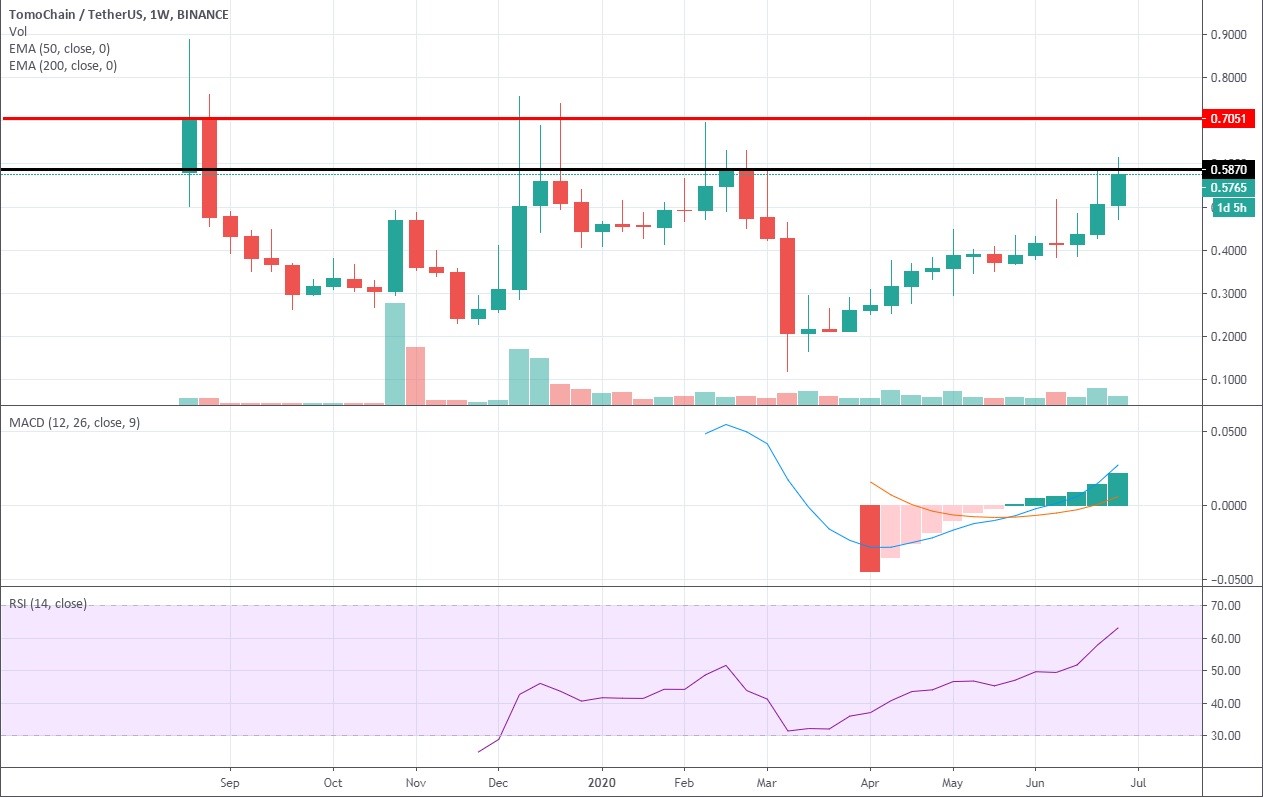
1-week TOMO/USDT chart
As you can see, TomoChain’s last rally was the most gradual and extended in the history of the 122nd cryptocurrency. They say that all roads lead to Rome, but in the case of TOMO, they always lead to the resistance level at $0.58, making it the so-called price magnet, towards which TOMO could be pulled even if it manages to turn the present resistance into support.
The major indicators on that time frame reveal that the bulls continue to accumulate power in this market as MACD is going strong to the upside after performing a bullish crossover on May 24 - those who relied on this signal should have made a 60% profit by now. Both lines of the indicators are already above zero and driving to the upside on the back of the growing green histogram, which is a major sign that the bullish momentum will persist. The 14-period RSI has taken a bullish stance ever since the deepest trough during the coronavirus crisis. Despite the evident northward direction, the indicator has just passed 60 in the neutral zone, so the bulls still have a lot of room to perform a breakout before the coin goes overbought.
The trading volume has been on the rise for the past two weeks that preceded the resistance testing, but traders must not expect sudden bursts of volume on the part of TOMO since they are uncharacteristic of this particular currency pair.
In order to understand how soon TomoChain might ascend above $0.58, let’s switch to the daily time frame that also tells the bullish story.
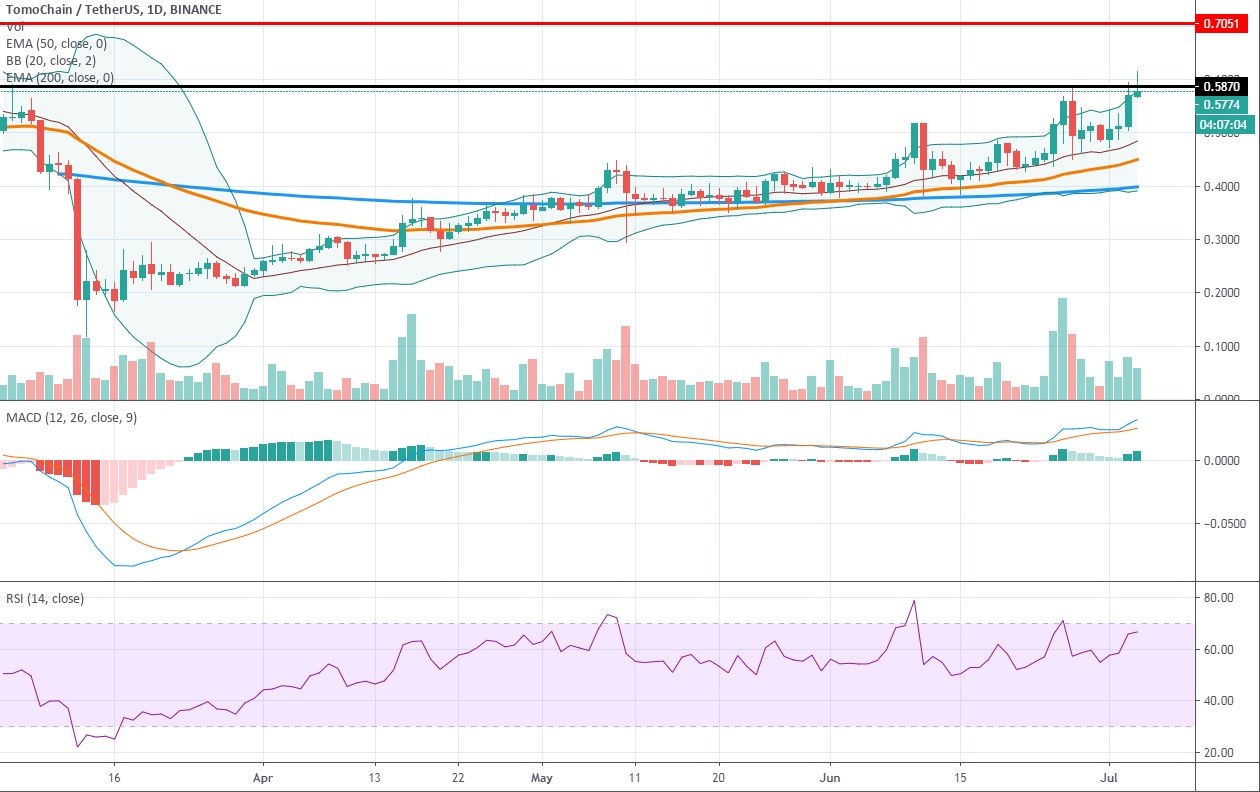
1-day TOMO/USDT chart
Please note that since the beginning of April, the price of TOMO had never descended below the middle line of Bollinger Bands, with the exception of a couple of times when lower wicks had penetrated the line. It serves as an ultimate sign that buyers have been dominating the market since the crisis reached its climax and don’t intend to hit the breaks unless the bears exert an overwhelming pressure in the next few days.
MACD retains its bullish position on this time frame, too, whereas RSI appears to be more passive, having been clinging to the neutral level at 50, though now it shows the intention to enter the overbought territory, which is likely to coincide with the resistance breakout.
All in all, we predict that TOMO will overcome the resistance and entrench above $0.58 over the next week.
Author: Alex Paulson for Crypto-Rating.com


Top Cryptocurrencies with Price Predictions
| # | Crypto | Prediction | Accuracy | CVIX | Price | 24h | 7d | Market Cap | 7d price change | |
| 1 | Bitcoin predictions | 84.8% | 25 | $64 485.37 | 0.33% | 1.53% | $1 269 733 248 757 | |||
|---|---|---|---|---|---|---|---|---|---|---|
| 2 | Ethereum predictions | 72.8% | 47 | $3 156.53 | 0.53% | 2.97% | $385 248 931 720 | |||
| 3 | Tether predictions | 93.2% | 1 | $0.999827 | 0.02% | -0.07% | $110 444 368 558 | |||
| 4 | Binance Coin predictions | 88.4% | 20 | $614.21 | 1.01% | 11.23% | $90 649 755 653 | |||
| 5 | Solana predictions | 69.6% | 68 | $144.92 | -1.92% | 1.99% | $64 801 943 270 | |||
| 6 | USD Coin predictions | 94% | 2 | $1.000042 | -0.01% | 0% | $33 354 239 535 | |||
| 7 | XRP predictions | 68.4% | 64 | $0.525514 | -0.36% | 4.48% | $28 971 123 639 | |||
| 8 | Dogecoin predictions | 70.4% | 60 | $0.151394 | 0.03% | -0.69% | $21 806 112 367 | |||
| 9 | Toncoin predictions | 68.8% | 64 | $5.41 | -2.56% | -16.87% | $18 789 466 535 | |||
| 10 | Cardano predictions | 62.4% | 72 | $0.471080 | -0.81% | 2.82% | $16 786 416 060 | |||
| 11 | SHIBA INU predictions | 62.4% | 79 | $0.000026 | 0.19% | 12.90% | $15 155 447 928 | |||
| 12 | Avalanche predictions | 63.6% | 75 | $35.58 | -2.16% | 2.12% | $13 458 015 785 | |||
| 13 | TRON predictions | 83.6% | 21 | $0.117230 | 3.54% | 7.22% | $10 265 718 725 | |||
| 14 | Lido stETH predictions | 96% | 1 | $2 941.39 | -0.40% | -3.32% | $10 258 752 564 | |||
| 15 | Wrapped TRON predictions | 84.4% | 18 | $0.117092 | 3.24% | 7.19% | $10 253 646 591 |