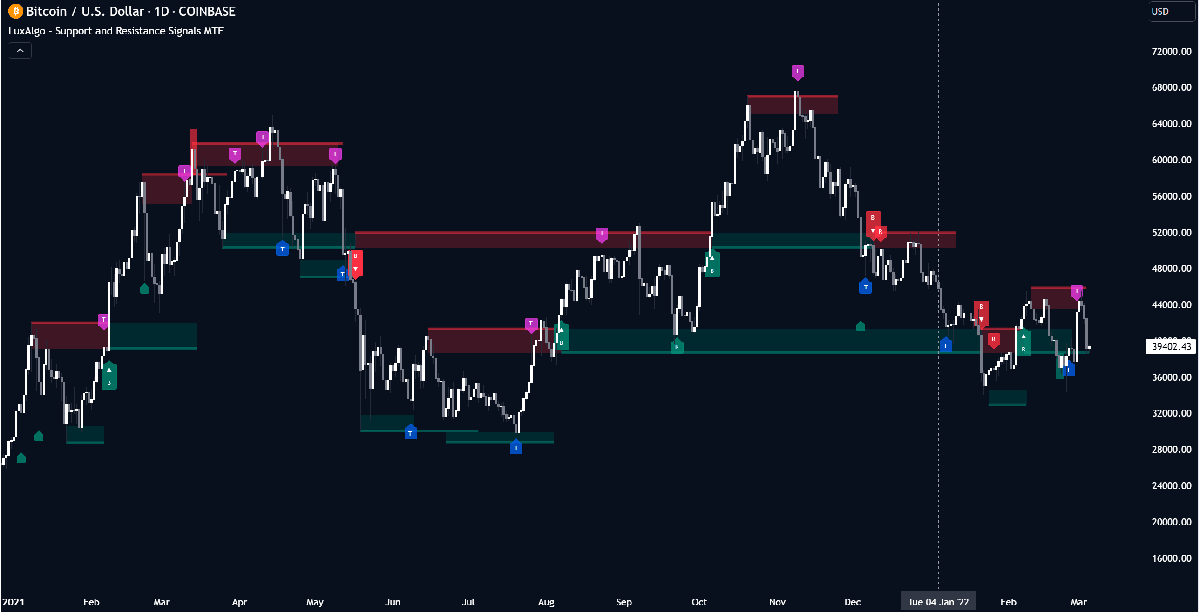
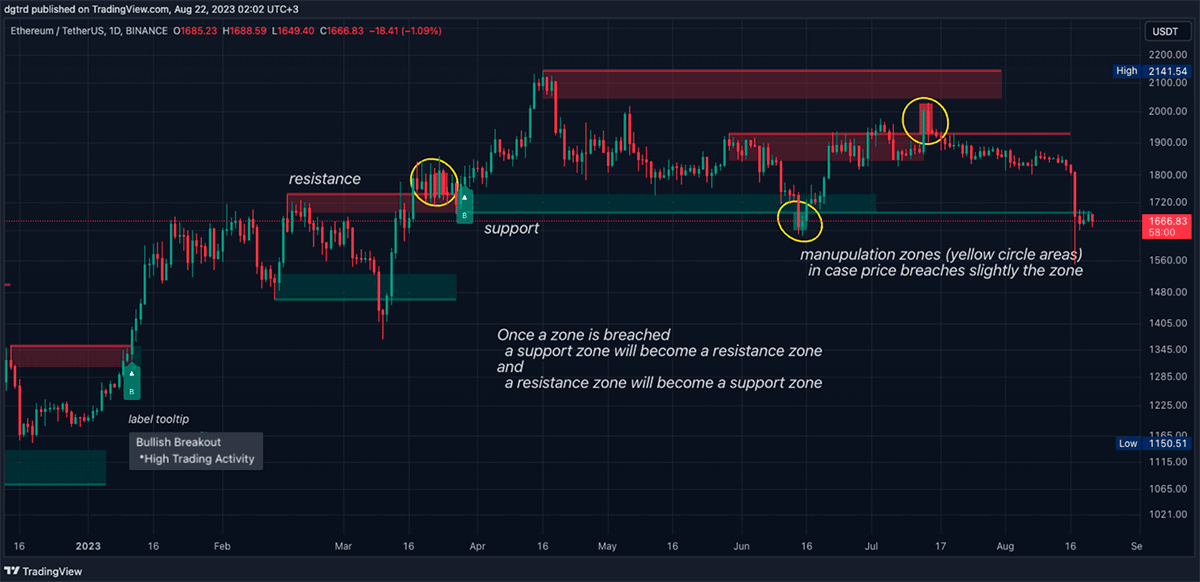
Expanded Overview: Unlocking the Power of Support and Resistance Levels
Alex Paulson
Crypto and Forex professional trader, analyst, contributor.
Support and Resistance levels stand as the cornerstone in the domain of technical analysis, providing traders with a conceptual foundation that, while seemingly simple, can be nuanced and intricate to fully command. It is within these levels that traders seek to decipher historical price reactions, which in turn can serve as a predictor of future price movements.
Theoretical Framework
Support and Resistance levels are fundamentally, points of pivotal change, congestion areas, or psychological thresholds perceived as significant by market participants. They are discerned within different timeframes, with higher timeframes bolstering their relevance. The simplicity of the concept lies in its identification of areas where price has historically reacted by reversing or decelerating.
Nuanced Understanding: Delineation and Practical Application
While these levels are foundational, deciphering the most consequential ones necessitates extensive practice and discernment. They manifest due to the convergence of buyers or sellers at certain critical points. Understanding the reciprocal roles of these levels—how they interchange between acting as support and resistance—is pivotal for trading within market ranges, anticipating reversals, bounce trades, or strategizing for breakouts. Traders often employ distinct rules for entry and exit depending on the trade type under consideration.

Core Principles: Support and Resistance
- Support Level: Signifies a price point where the predominance of buyers impedes further price depreciation, often leading to upward momentum.
- Resistance Level: Represents a point where sellers typically overwhelm the market, inducing a potential downward trajectory in price.
In-depth Analysis: Probabilistic Nature and Delineation
Traders must embrace the inherent uncertainty and probabilistic nature of these levels. The terms ‘often’ and ‘may’ underline the non-absolute nature of price reversals at these junctures. It is commonplace for prices to breakthrough support, or overshoot resistance levels, continuously ascending or descending. A multifaceted understanding of the robustness or frailty of these levels is critical, necessitating a shift from viewing them as precise points to more realistic, fluctuating zones.

Incorporating Real-world Dynamics
Variability Across Currency Pairs and Time Frames:
- EUR/USD Pair: The zones might oscillate between 20-50 points on daily charts, accounting for inherent market characteristics.
- GBP/USD Pair: Given its volatile nature, zones could be around 30-60 points.
- USD/JPY Pair: The varying monetary policies have amplified zone ranges, echoing increased volatility.
Adapting to Volatility
Highly volatile periods, especially around pivotal economic releases, demand dynamic strategy recalibration and adaptation, taking into account the broadening zone widths and fluctuating market conditions.
Methodical Identification and Analytical Tools
Deciphering these levels and zones involves amalgamating psychological thresholds, voluminous trading junctures, and historically significant points. A visual exploration of price charts, supplemented by specialized indicators and graphical tools like MetaTrader-4, provides a comprehensive insight into constructing effective levels and channels.
Delving into Strength and Resilience
A level’s resilience is discerned by examining its historical relevancy, trading volume, multiple confirmations, and alignment with fundamental market indicators. The deployment of indicators like Moving Averages, Fibonacci Retracement, Pivot Points, and Bollinger Bands can further sharpen analytical precision, demarcating potential support and resistance zones with enhanced accuracy.
Strategic Synthesis and Tactical Mastery
Employing a deep understanding of support and resistance levels in synchrony with intricate trading strategies like "Breakout/Breakdown Trading," "Buy Low, Sell High," and "Bounce Trading" can elevate trading prowess and market insight. However, the integration of these levels should be approached with analytical rigor, balancing theoretical insights with pragmatic applications, and harmonizing various tools to navigate the intricacies of financial markets effectively.
Final Reflections: Strategic Harmony and Risk Mitigation
The mastery of support and resistance levels paves the way for a robust trading arsenal, but it’s imperative for traders to maintain a vigilant and adaptive stance. These levels are not foolproof and should be integrated with meticulous analysis and prudent risk management to navigate the inherently uncertain and volatile trading landscape proficiently. Achieving a harmonious blend of theoretical acumen and practical application enables traders to traverse the unpredictable realms of trading markets with heightened assurance and refined insight.
Top Cryptocurrencies with Price Predictions
| # | Crypto | Prediction | Accuracy | CVIX | Price | 24h | 7d | Market Cap | 7d price change | |
| 1 | Bitcoin predictions | 83.6% | 32 | $63 960.23 | 5.53% | 1.49% | $1 259 624 246 795 | |||
|---|---|---|---|---|---|---|---|---|---|---|
| 2 | Ethereum predictions | 83.2% | 31 | $3 146.88 | 3.82% | 0.32% | $377 927 143 096 | |||
| 3 | Tether predictions | 95.6% | 1 | $1.000195 | 0.01% | 0.08% | $110 790 661 927 | |||
| 4 | Binance Coin predictions | 86% | 17 | $591.84 | 3.65% | 0.60% | $87 348 705 307 | |||
| 5 | Solana predictions | 70% | 67 | $147.87 | 4.42% | 7.63% | $66 148 440 023 | |||
| 6 | USD Coin predictions | 92% | 1 | $1.000010 | -0.02% | 0% | $33 516 817 768 | |||
| 7 | XRP predictions | 76.4% | 50 | $0.537165 | 2.68% | 4.12% | $29 670 786 186 | |||
| 8 | Dogecoin predictions | 70% | 62 | $0.163234 | 18.81% | 12.53% | $23 530 289 805 | |||
| 9 | Toncoin predictions | 70.8% | 64 | $5.74 | 5.76% | 9.81% | $19 940 795 740 | |||
| 10 | Cardano predictions | 66% | 71 | $0.470731 | 2.84% | 2.98% | $16 782 693 618 | |||
| 11 | SHIBA INU predictions | 70.4% | 58 | $0.000026 | 8.41% | 4.83% | $15 075 702 112 | |||
| 12 | Avalanche predictions | 67.2% | 73 | $36.08 | 4.16% | 5.58% | $13 720 524 126 | |||
| 13 | TRON predictions | 86% | 20 | $0.123236 | 0.55% | 2.47% | $10 786 244 739 | |||
| 14 | Wrapped TRON predictions | 88.4% | 21 | $0.123198 | 0.64% | 2.59% | $10 782 859 062 | |||
| 15 | Polkadot predictions | 66% | 66 | $7.20 | 0.58% | 8.34% | $10 357 304 928 |


