


Bitcoin (BTC) Enters Another Bearish Autumn?
About a week ago, when Bitcoin (BTC) was still hitting its head against the resistance at $12,500, numerous cryptocurrency experts had been preaching about the almost inevitable breakout to $14,000 that should have broken the so-called “$12K spell,” under which the dominant cryptocurrency has been for nearly three years.
The September blue of Bitcoin
But contrary to their expectations, Bitcoin has had the second-biggest flash crash of the year that bears a resemblance, in terms of its intensity, with the March meltdown. It appears that the Bart Simpson pattern, which we had distinguished in one of our previous BTC price prediction articles, is now in its finalization stage after the price has made yet another futile attempt at pushing past $12,500.
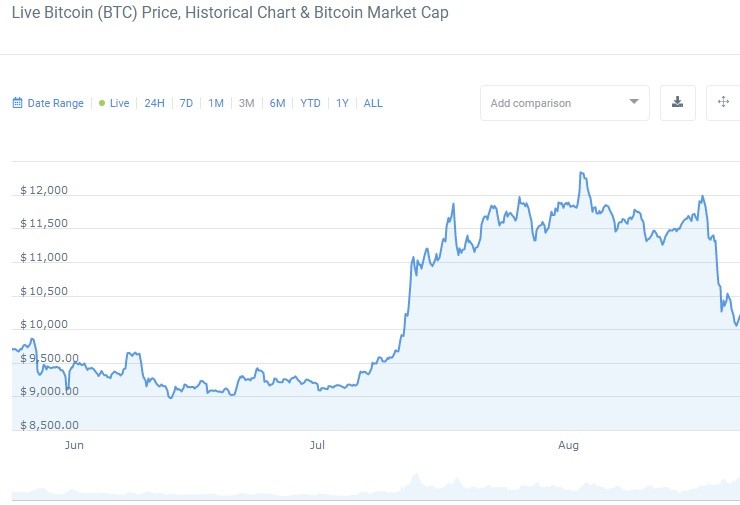
3-month BTC price chart
Considering that for the past two years, the fall has been a down season for Bitcoin: in 2018, BTC got devalued by 55% in the period from September until December, and by 41.3% over the same period in 2019, as shown on the monthly chart below.
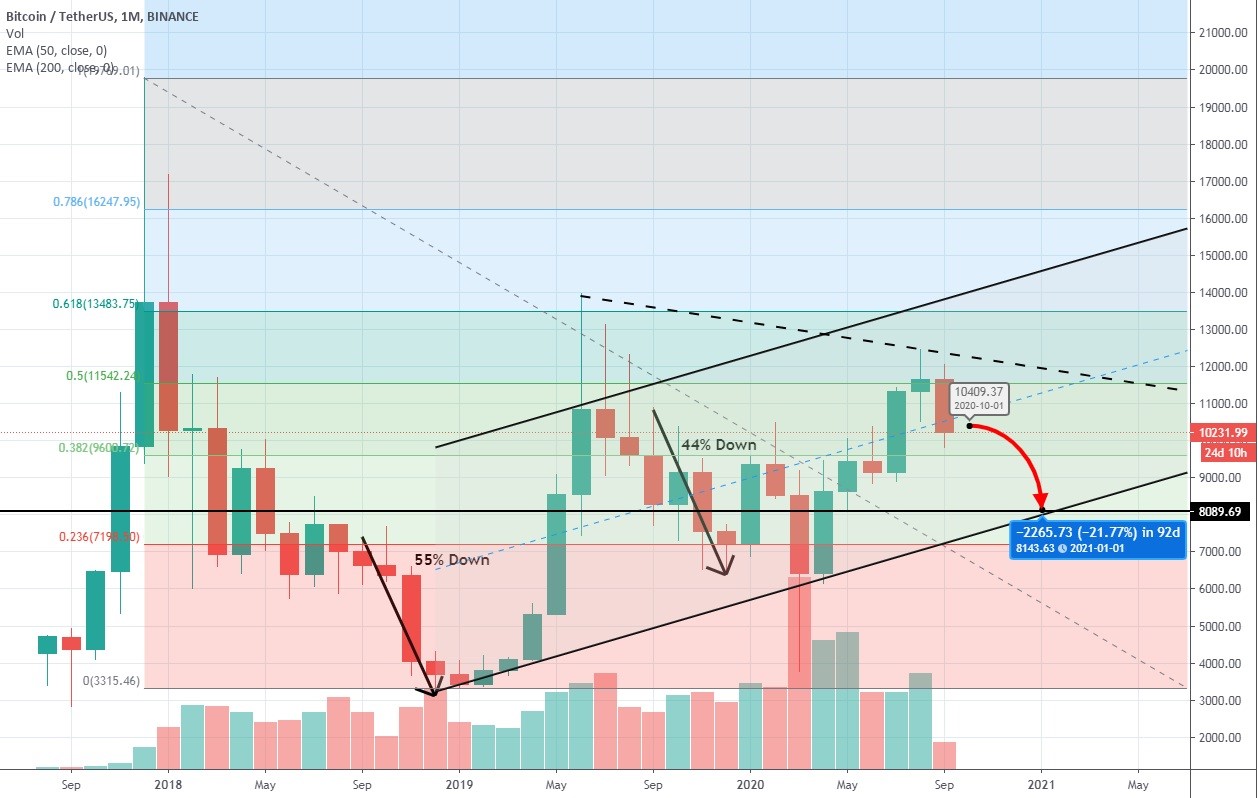
1-month BTC/USDT chart
Some might argue that September of 2018 was the month when the infamous bull market had been given a spark, but that occurred within the context of a bubble, whereas now we are witnessing a natural uptrend development with its upswings and troughs. Therefore, the latest 20% drop on the monthly time frame, instigated by a significant pullback across traditional markets, give us enough reason to believe that sellers will have the upper hand in the largest cryptocurrency market for the next two to three months with the high likelihood of BTC descending to the area between $8000 and $9000 at a certain point in time, thus increasing the overall losses for that period to 34%.
A regular pullback or a Minsky Moment
But even such seemingly big losses would still keep Bitcoin within the bullish framework since even a drop to $8100 would keep the price within the confines of the rising channel as it would form a lower high, as well as the symmetrical triangle pattern, with further prospects of breaking it to the upside.
However, there are two factors, namely, the expected second wave of COVID-19 pandemic and the U.S. presidential elections, that could either exacerbate the bearish pressure or tip the scales in the opposite direction. Many prominent analysts also talk about the Minsky Moment in traditional markets - an abrupt market collapse following the unsustainable bullish period, which, in our case, was caused by the first stimulus package from the Federal Reserve.
To summarize, while Bitcoin draws a bullish picture on the macro scale, there are piling evidence of a looming deeper pullback to the $8,000 region in the near future.
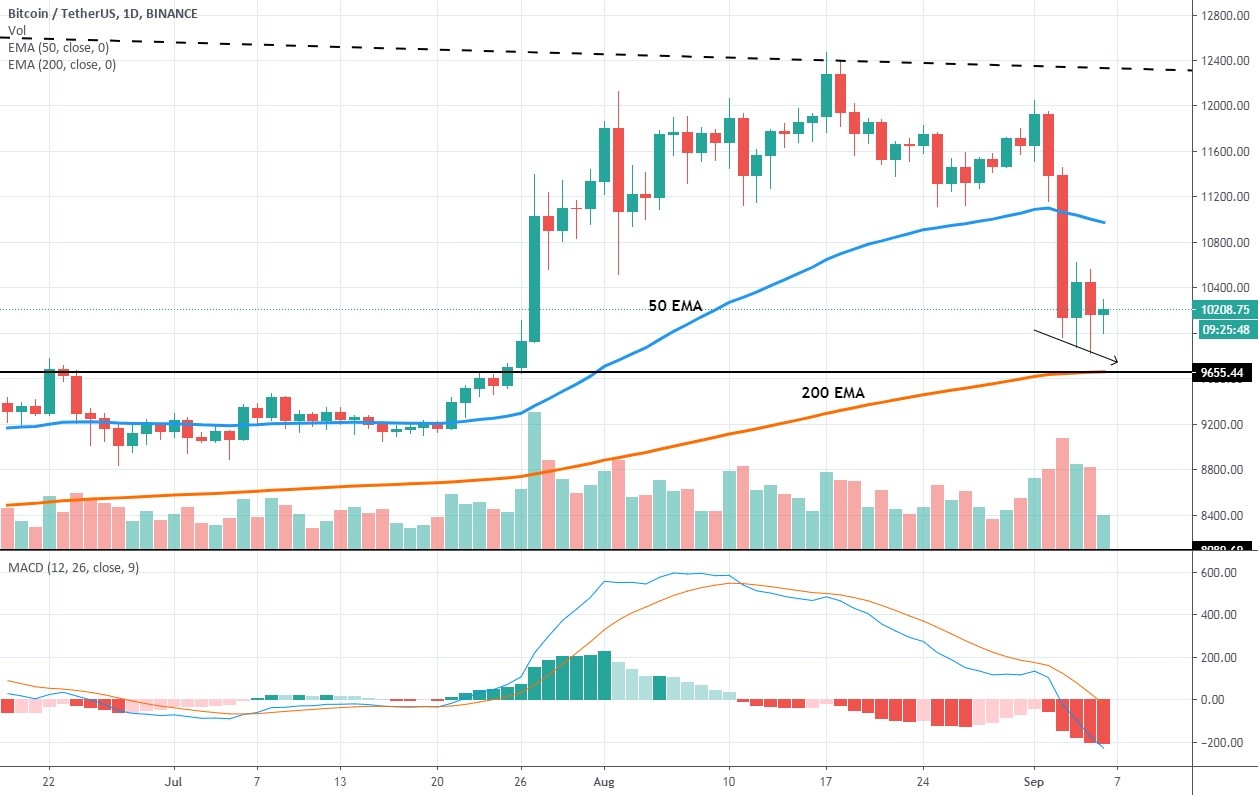
1-day BTC/USDT chart
On the daily time frame, the price action has been stalling near the psychological level at $10,000, but the sinking lower wicks on daily candles suggest that the bears are drilling through this support level, so in the next few days, traders should expect a drop to $9,600, the level that happens to coincide with the current position of the 200-period EMA and the 0.382 level on the Fibonacci retracement grid.
Author: Alex Paulson for Crypto-Rating.com


Top Cryptocurrencies with Price Predictions
| # | Crypto | Prediction | Accuracy | CVIX | Price | 24h | 7d | Market Cap | 7d price change | |
| 1 | Bitcoin predictions | 81.2% | 25 | $64 423.02 | 0.25% | -0.25% | $1 268 510 807 345 | |||
|---|---|---|---|---|---|---|---|---|---|---|
| 2 | Ethereum predictions | 73.2% | 46 | $3 142.69 | -0.45% | 1.43% | $383 564 040 177 | |||
| 3 | Tether predictions | 91.6% | 1 | $1.000166 | 0.04% | -0.02% | $110 481 898 752 | |||
| 4 | Binance Coin predictions | 84.8% | 21 | $609.04 | 0.30% | 9.23% | $89 869 991 425 | |||
| 5 | Solana predictions | 65.6% | 71 | $143.92 | -2.36% | -1.01% | $64 352 644 231 | |||
| 6 | USD Coin predictions | 92% | 2 | $1.000201 | 0.02% | 0.01% | $33 357 756 284 | |||
| 7 | XRP predictions | 66% | 68 | $0.530041 | 0.64% | 6.01% | $29 220 719 187 | |||
| 8 | Dogecoin predictions | 66.4% | 65 | $0.150674 | -0.47% | -2.00% | $21 702 987 794 | |||
| 9 | Toncoin predictions | 67.6% | 65 | $5.39 | -1.53% | -22.75% | $18 712 567 250 | |||
| 10 | Cardano predictions | 61.2% | 77 | $0.473194 | -0.78% | 3.08% | $16 861 751 514 | |||
| 11 | SHIBA INU predictions | 60.4% | 82 | $0.000026 | 1.76% | 12.28% | $15 045 547 820 | |||
| 12 | Avalanche predictions | 66% | 75 | $35.48 | -0.33% | -0.24% | $13 420 028 390 | |||
| 13 | Wrapped TRON predictions | 84.4% | 18 | $0.117162 | 2.61% | 8.61% | $10 259 776 879 | |||
| 14 | Lido stETH predictions | 93.6% | 1 | $2 941.39 | -0.40% | -3.32% | $10 258 752 564 | |||
| 15 | TRON predictions | 86.8% | 21 | $0.116909 | 2.61% | 8.05% | $10 237 641 574 |