


What’s Next for the Price of Bitcoin After the Brutal Crash
The recent developments on the Bitcoin market have completely dispelled all hopes of bullish-minded cryptocurrency traders regarding BTC’s swift recovery after a brutal takedown, performed by the Chinese government in pair with Elon Musk, who has become the archvillain for the crypto community after bashing the dominant digital asset for being hazardous to the environment.
We have covered the reasons behind the ongoing bloodbath in the previous article; now, let’s try and figure out what the near-term future holds for Bitcoin. As it usually happens, the opinions within the community of cryptocurrency traders and investors regarding the fate of BTC have been polarized. Some are predicting dark times for Bitcoin and the repetition of the crypto winter, similar to the one that preceded the bull run, while others are arguing that it’s just a temporary bearish phase caused by unforeseen events, and the market would return to its bullish ways once it absorbs the damage caused by the infamous China ban on crypto.
Since cryptocurrency trading is the game of probabilities, we can’t disregard any of those viewpoints and arguments because even the gloomiest scenarios might be realized in the current conditions. We have seen that happening in 2018, and there is absolutely no guarantee that history won’t repeat itself and Bitcoin would shed many more thousands off its present value until it finds a solid support level from which it could begin to recover.
On the other hand, the perception of Bitcoin has changed dramatically over the past year and a half. Now we have numerous large institutional investors, corporations, and even governments, relying on Bitcoin for different reasons, as opposed to the situation in 2017/2018, when the first bull market was supported largely by retail traders and investors, who got caught up in the FOMO.
In any case, it is clear that despite the ominous prediction from the likes of Peter Schiff, a long-time Bitcoin critic, the first cryptocurrency has established a strong foothold in the global economy that is currently reinventing itself after a major crisis, instigated by the COVID-19 pandemic. Therefore, we can straightaway rule out the possibility of BTC crashing to zero or even going back to pre-bull run lows at $3,000, though it’s clear that we shouldn’t expect the price to hit another all-time high, which is predicted to be around $75,000, any time soon.
At the moment, Bitcoin stands at a crossroads, and we could see it going into the full-fledged bear market. After all, summer has never been the bullish season for the cryptocurrency market as a whole, and Bitcoin in particular, but, as already mentioned, the landscape has shifted dramatically, and there are much more powerful actors involved in this space who wouldn’t want to see the capitulation of both BTC and altcoins, especially those that are related to the sector of decentralized finance (DeFi).
In this prediction article, we will cover all possible scenarios and provide a thorough technical and fundamental analysis of the present situation that will determine the behavior of the Bitcoin price in the months to come. But one thing is for sure; Bitcoin has embarked on the road to becoming the global currency and a powerful alternative to the existing global monetary system, which is crumbling before our eyes. The fantastic bull run from $8,000 to $64,000 couldn’t have lasted forever, and a fall into a deep trough was imminent. Now we have to accept the new reality, figure out where BTC might go from there, and adapt the trading and investment approaches accordingly.
What does technical analysis say?
Like any disciplined analytics, we will start our analysis of the Bitcoin market by reviewing the developments on the weekly BTC/USDT chart. It is clear that BTC had reached the peak of its bull run when it had failed to overcome the stubborn resistance at $60,000, which it had tested multiple times in the period from March 21 until May 21, when Elon Musk came out with his anti-Bitcoin announcement regarding the suspension for payments in BTC for the Tesla electric cars. In addition, the Tesla corporation had offloaded around $100 million worth of BTC in the light of its CEO’s largely unfounded accusations, which had only exacerbated the fall.
The infamous crackdown by the Chinese government on cryptocurrency payment providers and miners had put another dagger in the bulls’ coffin, which ultimately caused BTC to shed 50% of its value in a matter of seven weeks.
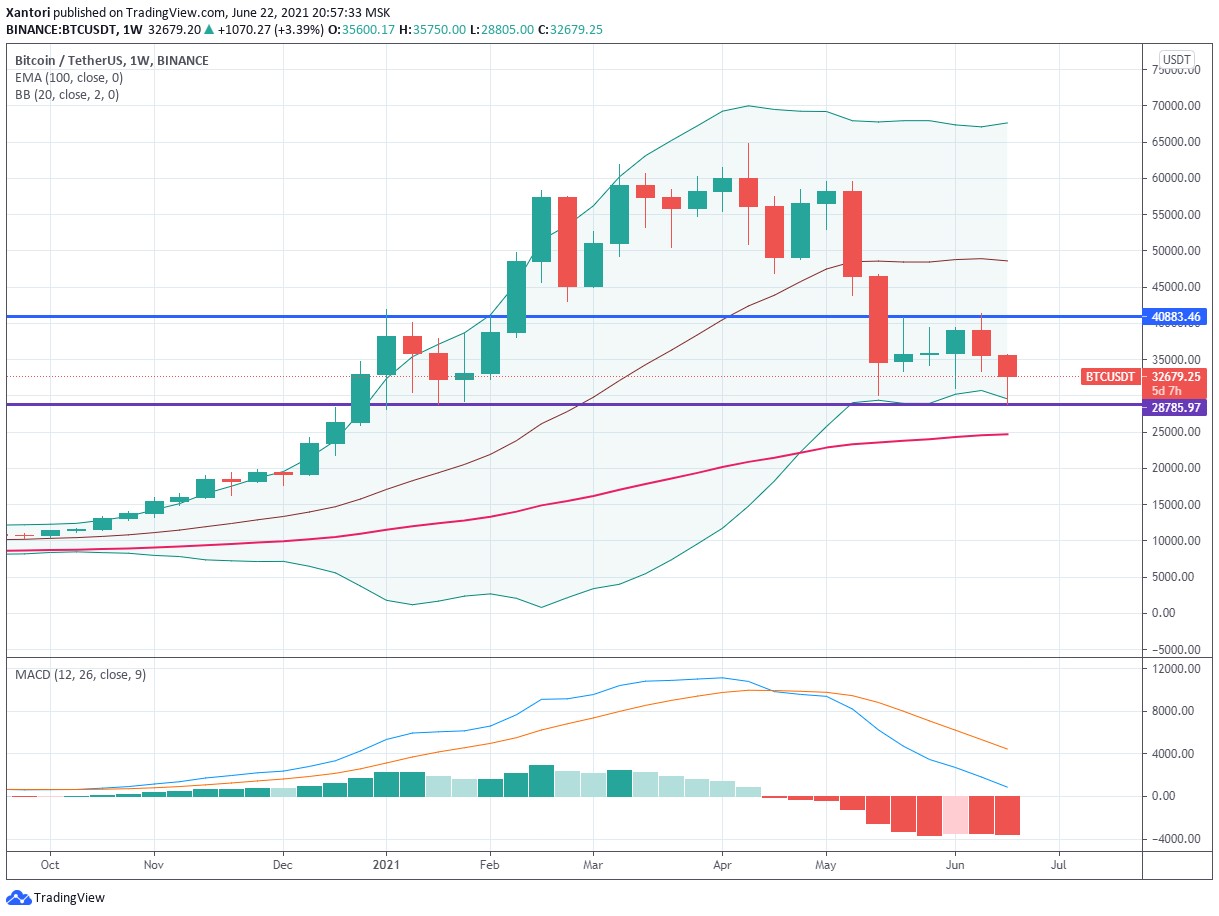
1-week BTC/USDT chart. Source: Tradingview
The weekly chart above shows that the buyers are trying vigorously to protect the support level at $28,000 that had formed mid-way to the interim market top. Back then, the market had also established the resistance level at $40,000, which the price had already tested twice but to no avail.
Obviously, these price levels are of the utmost importance at the current stage: should buyers fail to protect it, the price might easily continue its descent to $24,000, which would fall in line with the recent prediction made by Robert Kiyosaki, the famous entrepreneur and author of the bed-side book “Rich Dad Poor Dad.” In his recent interviews with financial media outlets, Kiyosaki warned about the “biggest crash in the history of the world” and suggested that Bitcoin would drop to $24,000, which is a distinct possibility, given the unfolding events on the market.
We can’t discard his point of view because Kiyosaki has always been a vocal proponent of BTC, so we can’t accuse him of having a negative bias towards the first cryptocurrency.
In one of his recent tweets, Kiyosaki urged against making savings in USD, labeling it a failing currency because of the “incompetence of the U.S. government, Fed and Wall Street.” On the other hand, the financial guru predicted that in five years, Bitcoin would be worth around $1.2 million, which is a clear hint that the bull market would persist. And while this statement might seem a bit far-fetched, there are many reasons to believe that $100,000 is a reachable target for Bitcoin in 2021, especially if it would be able to withstand the current selling pressure and negate the bearish expectations.
The market seems to agree with the best-selling author since it is crystal-clear that the momentum has “bearish” written all over it. The MACD indicator has both its moving averages heading south towards the zero line while the last weekly histogram is growing larger than all the preceding ones. There is a possibility that the MACD line (blue) would get rejected once it kisses the zero line, which happens in this market quite often. In that case, we will see Bitcoin bouncing off the support at $28,800 and aiming for the resistance at $41,000. If that move plays out, BTC will establish a range between the corresponding areas of price interaction, at which point, we could begin talking about the commencement of the consolidation period with the prospect of a breakout to the middle line of the Bollinger Bands indicator that hovers around the $48,000 zone. From then on, Bitcoin might retrace back to $40,000 to test it as the level of support. Should that level hold, BTC would have an open road towards $60,000 and would also negate the bearish scenario.
However, there are many factors that speak for the continuation of the bearish trend, for instance, the forced exodus of Bitcoin miners from China, which will cover later in the article, as well as the overall negative sentiment among most market participants, which is reflected in the Bitcoin Fear & Greed index that currently stands at 10, the extreme fear. It means that there are a lot of “paper hands,” traders who are prone to panic-selling when the market is tumbling, so a move below $28,000 might trigger another wave of aggressive selling that would drop the price of BTC to the 100-day moving average, which, coincidently, sits near the $24,000 zone, foreseen by Robert Kiyosaki.
In that case, there is a distinct possibility that Bitcoin would briefly pierce through that level and find itself at $20,000. This notion is supported by the ongoing interaction between BTC and the lower band of Bollinger Bands, where the price is testing the line and trying to stretch it to the downside, which usually serves as a prerequisite for further price degradation.
It will all depend on where the current and the next weekly candles would close: should they close at or above $30,000, there would be a higher possibility of realization of the moderately bullish scenario that would see Bitcoin establishing the range between the said price levels. The price might stay within the confines of that range for a while, perhaps even for a few months until the fall, which has traditionally been a bullish season for the cryptocurrency market.
Historically, BTC has displayed the tendency towards prolonged ranging after periods of high volatility, so the next several months could pose a splendid opportunity to accumulate more coins or sats, depending on which level you operate, in anticipation of the continuation of the bull market.
It is also worth mentioning the Stock-to-Flow (S2F) model, created by PlanB, which is highly popular among traders and members of the so-called crypto Twitter. This model has proven to be rather accurate during the previous stages of the Bitcoin market.
The anonymous analyst suggested that the ongoing brutal correction is nothing more than a “mid-way dip” which the buyers would eat away by October, and the price would regain the $63,000 level. According to this prediction, Bitcoin would make a trip from $47,000 in August to $63,000 in November and then go on to establish new all-time highs at $93,000 by November and $135,000 in December, thus providing a great Christmas present for cryptocurrency traders and investors. PlanB noted that the rise to $135,000 by year’s end constitutes the “worst-case scenario,” whereas the best-case scenario for this market foresees the exponential growth of BTC value to $450,000 within the same time frame.
And while we would only welcome such developments, a genuine Bitcoin trader must keep a cool head because the reality dictates that the crisis is far from being over, and once it runs its course, the bulls might not have enough buying power to push the price up ten-fold.
Such a move would require a prompt injection of gigantic capital into this market: given Bitcoin’s present market capitalization at $608 billion, it would require over $60 billion of additional capital to move the price even 10% to the upside, not to mention the liquidity needed to push the price to such heights as $450,000. It’s not that the attainment of this price level is impossible - we are certain that BTC will be worth more than that in the coming years. However, it would be a borderline miracle if such a vast amount of capital would flow back into the cryptocurrency market against the backdrop of the mining crisis and the overall FUD (fear, uncertainty, and doubt) on the global markets.
But let’s zoom in on the charts and check the situation on the daily time frame because it has one bearish pattern that invoked a heated discussion within the crypto community.
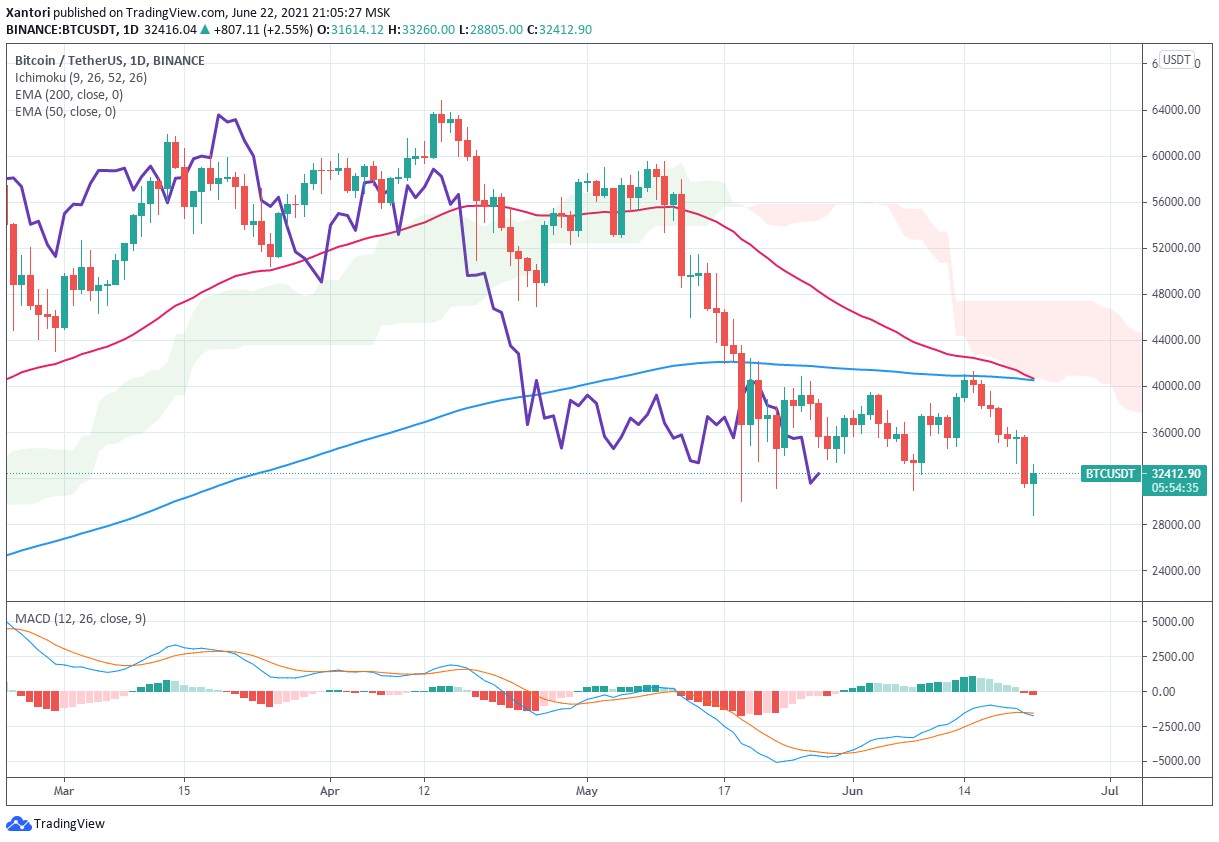
1-day BTC/USDT chart
The pattern at hand is the infamous death cross, a formation that is formed when the faster-moving average (usually the 50-period MA) crosses the slower one (the 200-period MA) to the downside, which is generally considered as a sign of the large looming sell-off. The chart above clearly shows that such a cross-over is about to occur, which gives strength to the bearish narrative. The emergence of the death cross usually suggests that the underlying asset is overvalued, so the acceleration of selling is to be expected. Historically, when this pattern appeared on higher time frames, the price of Bitcoin dipped from 30% to 70%, though the severity of each drop has been declining over time.
Truth be told, the cross patterns, whether it’s a death cross or a golden cross, don’t always play out on the cryptocurrency market. There have been many instances of price erupting to the upside shortly after the formation of the death cross. For instance, in 2019, Bitcoin had already dived 47% before the death cross started to take shape, which was followed by a swift 52% recovery, which negated this pattern. Another example occurred in 2020 when BTC dipped 64% and faced the death cross - instead, the price pumped by 150% and initiated a bull market.
But given the attention that is being focused on that pattern, it could become a self-fulfilling prophecy since many retail traders would be trading it and offloading what’s left of their BTC positions once the faster MA fully crosses the slower one. In that case, the price could take a short journey to the upside but ultimately get rejected at $37,000 - $38,000, the spot where the 50 MA should turn out over the next week. Besides, the MACD indicator shows that there is an approaching shift in the momentum as the MACD line is about to cross the signal line to the downside, which usually results in the downward price action.
Moreover, we need to pay attention to the Ichimoku Cloud indicator that features the forward-looking element called Kumo Cloud that is currently bloated and painted red, which is the sign of strong overhead resistance and the overall bearishness of the market. The lagging span (the purple line) that moves slightly behind the candlesticks, draws the pattern that is reminiscent either of a broadening wedge (bearish pattern) or a bearish flag, which points at the probable continuation of the downward trend in the coming weeks.
To summarize, the analysis of price action on higher time frames leads us to believe that the bearish stage of the current market cycle is far from being over since the only evidence that speaks in bulls’ favor is that the buyers are fighting tooth and nail to protect the support level at $30,000. Besides, when reviewing the order book on the BTC/USDT market, we noticed a large cluster of sell orders that starts at $37,500 and goes to $41,000 where we registered the order to sell around 700 Bitcoin, large enough to reverse the market in the bearish direction.
The buyers’ side, on the other hand, looks pronouncedly weak since there is a glaring gap between the current price level and the one at $26,600, where there is a sizable cluster of buy orders for nearly 1000 BTC.
All in all, our own vision of the upcoming price action on the BTC market falls in line with that of Kiyosaki - at the current level, the bulls do not possess enough power to flip the table over and initiate a bull run, while the bears remain in the driving seat. Therefore, we predict that Bitcoin would have an episode of bullish action that would place the price at $40,000 - $41,000, upon which it would collapse to $26,000 - $24,000. This scenario will be negated if BTC breaks above both 50 MA and 200 MA and turn them into the level of support. But in the longer run, approximately until the end of the year, Bitcoin will recover after the recent crash and retest the resistance at $60,000, with the possibility of extending to $75,000.
The Wyckoff pattern: we might be witnessing a large-scale market manipulation
With technical analysis out of the way, let's ask ourselves a simple question. What is going on behind the scenes, and what happens when all retail traders start to rely on a single indicator or pattern, like the death cross. The answer is quite straightforward: the overwhelming fear and the continuous hard-selling of some narrative, the bearish one in our case, makes it very easy for the whales, the big market players with immense capital, to manipulate the market and push the price above or below the expected price ranges, ultimately shaking off the weak hands and accumulating more BTC before its price erupts. It's no secret that due to its relative immaturity, the cryptocurrency market in general, and the Bitcoin one in particular, can be manipulated by the large sharks in the pond who are preying on retail traders and their fears.
This type of behavior was first noticed by Richard Wyckoff, a prominent American stock market investor who earned a reputation as a real guru of technical analysis since some of his findings, particularly the so-called accumulation price pattern, also known as the Composite Man theory, is still widely applied by traders across all financial markets.
Wyckoff formulated this pattern back in the 1930s while operating on Wall Street alongside such industry titans as J.P. Morgan and Charles Dow. Back then, it was common for large institutional players to shamelessly manipulate the markets for the purpose of forcing the unsavvy retail traders to abandon their stocks and commodities for whales to scoop up easily.
Basically, Wyckoff suggested that any financial market should be approached as if it was controlled by a single powerful entity (a Composite Man) that is capable of moving the price at its own discretion. In that case, the only way for a retail trader to profit from the manipulated market is to gain an understanding of how the manipulator works and what goals he is trying to achieve; otherwise, a trader risks being totally rekt by the dominant force.
One might laugh at this notion and remember the popular Internet meme featuring the Bogdanoff brother, who orders the invisible market actor to "pump it" when a goofy trader makes a sell and "dump it" when the trader goes all-in on the breaking market.
In reality, there is no conspiracy among the whales to pump and dump the price of Bitcoin or any other asset in concert to shake off the excessive passengers. According to Wyckoff, the large players are simply playing by their own set of rules that often differ significantly from those utilized by retail traders. Instead of paying attention to the behavioral patterns, like the death cross, they focus on the price areas that are saturated by traders who are waiting to buy or sell, preferably with substantial leverage on their positions. Perhaps that is the very reason why we have seen time and again when the price of Bitcoin drops below a certain level on the back of confirmations presented by numerous indicators only to snap back to the upside and continue to go in that direction. As a result, the institutions put their hand on cheap liquidated BTC, leaving retail traders frustratedly buying into the move, subsequently adding more puff to the bullish (or the bearish) impulse. In that scheme, the whales are not seeking to push the price of the underlying asset to some extreme lows; their sole purpose is to diddle the retail traders out of their money and then put it back onto the market when the conditions are more favorable for the big entities.
According to the Wyckoff method, a market crash of some sort is required to extend the duration and profitability of a bull cycle. That is the reason why the whales often seek ways to cause the market crash when the market itself appears overheated, and the price growth becomes unsustainable. It must be noted that the institutions don't want the asset price to fall too deeply for an extended period of time and give retail trades a chance to regroup and reconsider their strategies. And since it requires a substantial amount of capital to move the price of an asset with a large market capitalization, such as Bitcoin, institutions do so in several stages that had been noticed by Wyckoff. These stages of the Wyckoff price cycle are as follows:
- Accumulation;
- Distribution;
- Re-accumulation;
- Re-distribution.
Let's analyze this pattern phase by phase: in phase A, we see that the price action tends to form the level of preliminary support (PS), which in the case of Bitcoin, occurred at $50,000, right between the Tesla controversy and roll out of the crypto ban in China. Here the price is taking a breather before another violent drop.
The said drop ends with the selling climax (SC), which is often located far below a key support zone, which stood at $40,000. If you go back to the daily BTC/USDT chart, you will see that the selling climax occurred at $30,000.
- The SC phase is followed by one dubbed automatic rally (AR), which comes as a response to aggressive price manipulation. You can see for yourselves that upon dropping to $30,000, BTC had instantly rallied 40% to the 200-period MA or $42,000. But since at that stage, the retail traders are often too intimidated by the previous drop, the price tends to slide back to the zone of the secondary test (ST).
- In phase B, the price usually starts moving within the confines of the range defined by AR and ST. Here the institutions start to accumulate the asset in question while occasionally letting the price form bullish and bearish traps, thus nurturing the uncertainty and fear among retail investors that restrain them from entering the market.
- Phase C of the reviewed accumulation pattern is often characterized by the emergence of a spring after a sudden downtrend. As you have probably figured out, the Bitcoin market is currently in that phase since we had witnessed a massive sell-off after the bull trap that took place when the price had briefly gone past $39,000, only to be rejected at the 200-period MA and forced all the way to $28,900. It's too early to tell whether that move marked the completion of phase C or would see a further drop to the determined price zones at $26,000 or $24,000. Judging from our technical analysis provided above, we are likely to see another episode of bearish price action since the momentum remains on the side of the sellers. So far, the price dipped only 4% from the established support at $30,000, which might not be enough to completely cut off the weak hands and accumulate their capital. Therefore, try not to be too anxious to join the market at this stage or do so with small capital. We expect Bitcoin to drop lower to the outlined levels of support before it starts to recover and enters the next phase.
- In phase D of this pattern, the price of BTC should finally show a more or less sustainable growth, though it would also retrace to the so-called last points of support (LSP). You could differentiate the secondary tests from the last point of support by checking the sell volume that occurs during the retracement. In the case of LSP, the volume would be much lower than that registered when the action takes place near the ST zone, thus indicating that the occurring selling pressure won't cause the market to collapse again.
Before exiting the accumulation zone within the Wyckoff pattern, the price should showcase the sign of strength (SOS), an indication that the buyers have mustered enough power to maintain the rally. Once again, the difference between AR and SOS is that the latter would have a significantly larger buying volume, which always serves as a sure sign that the move is going to persist.
In addition, the SOS is confirmed when all or most previous levels of resistance are turned into support, with the last point of support (LPS) serving as a trampoline from which the price would leap straight to phase E, the final dash made by the price before it breaks out of the established range. Again, pay close attention to the buying volume because a genuine breakout occurs against the backdrop of a massive volume, almost without exceptions.
As if to confirm that institutional investors are trying to spread panic among retail traders, there has been a report by CoinShares which stated that the institutions have been on the longest selling streak since February 2018. At the same time, Michael Saylor, the CEO of MicroStrategy, announced that his firm had invested another $500 million in Bitcoin and upped its total BTC holdings to 100,000 coins. It's clear evidence that the whales have been remaining very active throughout all the phases in preparation for an imminent bull run.
Let’s touch upon the fundamentals
The recent cryptocurrency ban imposed by the Chinese government has shaken the market to its core and accelerated its downfall in conjunction with the alleged market manipulation by the institutional investors. We have covered the details of that ban in the previous article, so there is no need to reiterate what it implied and what effect it had on the price of Bitcoin.
But the “fun times” didn’t stop there: after taking the cryptocurrency payment services under its boot, the authorities have turned to miners and began what appears to be the biggest crackdown in the history of this industry. Last week, the government issued the order to electricity companies to stop supplying the power to mining farms across the entire country, with special emphasis being made on those located in the Sichuan province that is known for having multiple sources of hydroelectric power generated by levees, with cheap electricity being especially abundant during the wet seasons in that area. Due to that reason, nearly 90% of all mining in China took place in that particular province. As a result, the hashrate of BTC dropped to 140 EH/s, the lowest level in the past seven months, while the price shed another 10%. It’s like they say, when it rains it pours.
But while this aggressive measure against the largest mining community in the world has had negative consequences for the price of BTC in the short term, it might play in the hands of Bitcoin bulls in the long run. The thing is that before the crackdown, over 65% of all hash power was concentrated in China, the fact that raised concerns regarding the crippling centralization of the Bitcoin network. Besides, the aggregation of mining facilities in China gave the advantage to Bitcoin critics since the clean electricity in Sichuan could be obtained only during wet seasons; at other times, miners had to rely on the power plants that use fossil fuels, mostly coal.
There is no doubt that this ban will force Bitcoin miners to move overseas or to neighboring countries like Kazakhstan.
Perhaps the exodus of miners would be a blessing in disguise for the security and stability of the Bitcoin network, as well as its price in the mid-term future. It’s likely that all those miners would settle in the countries, the governments of which have a much more relaxed stance on Bitcoin mining, and that are able to provide adequate volume of power that come from renewables. The list of such countries includes the United States, Canada, and Sweden. Consequently, we will see the Bitcoin network becoming more stable, with predictable fees and transaction times, and, most importantly, far less centralized. It would undoubtedly have an overwhelmingly positive impact on the price of BTC since China would no longer pose a threat of causing the crises like the one we are experiencing now.
Author: Alex Paulson for Crypto-Rating.com


Top Cryptocurrencies with Price Predictions
| # | Crypto | Prediction | Accuracy | CVIX | Price | 24h | 7d | Market Cap | 7d price change | |
| 1 | Bitcoin predictions | 82% | 23 | $64 742.01 | 0.64% | 1.77% | $1 274 780 684 025 | |||
|---|---|---|---|---|---|---|---|---|---|---|
| 2 | Ethereum predictions | 76.4% | 51 | $3 172.49 | 0.83% | 3.31% | $387 195 965 458 | |||
| 3 | Tether predictions | 94.8% | 1 | $1.000151 | 0.10% | -0.03% | $110 480 177 546 | |||
| 4 | Binance Coin predictions | 88.8% | 19 | $613.50 | 0.94% | 11.20% | $90 545 078 851 | |||
| 5 | Solana predictions | 68% | 71 | $147.24 | -1.60% | 4.31% | $65 823 089 907 | |||
| 6 | USD Coin predictions | 92.8% | 2 | $1.000116 | 0.02% | 0.01% | $33 249 140 497 | |||
| 7 | XRP predictions | 68% | 62 | $0.529314 | -0.40% | 5.30% | $29 180 648 027 | |||
| 8 | Dogecoin predictions | 68% | 60 | $0.153170 | 0.05% | 0.04% | $22 061 749 961 | |||
| 9 | Toncoin predictions | 67.2% | 66 | $5.50 | -2.44% | -15.91% | $19 105 766 327 | |||
| 10 | Cardano predictions | 63.2% | 72 | $0.477005 | -0.38% | 4.34% | $16 997 547 087 | |||
| 11 | SHIBA INU predictions | 62.4% | 82 | $0.000026 | 0.41% | 14.42% | $15 421 640 594 | |||
| 12 | Avalanche predictions | 64% | 68 | $36.13 | -2.09% | 2.94% | $13 663 299 708 | |||
| 13 | TRON predictions | 88% | 21 | $0.117251 | 3.17% | 7.44% | $10 267 623 783 | |||
| 14 | Lido stETH predictions | 91.2% | 1 | $2 941.39 | -0.40% | -3.32% | $10 258 752 564 | |||
| 15 | Wrapped TRON predictions | 85.2% | 19 | $0.117125 | 3.03% | 7.70% | $10 256 553 245 |