


The Bulls Favor Enjin Coin (ENJ)
Enjin Coin is a shining example of a sturdy altcoin that refuses to be beaten down by the crises and lay quietly at the bottom. Moreover, the recent market crash had formed the ground for ENJ to push away from and initiate what appears to be a minor uptrend which could have the potential to transform into a secondary one as soon as the price defeats the crucial resistance at $0.21, highlighted on the chart below.
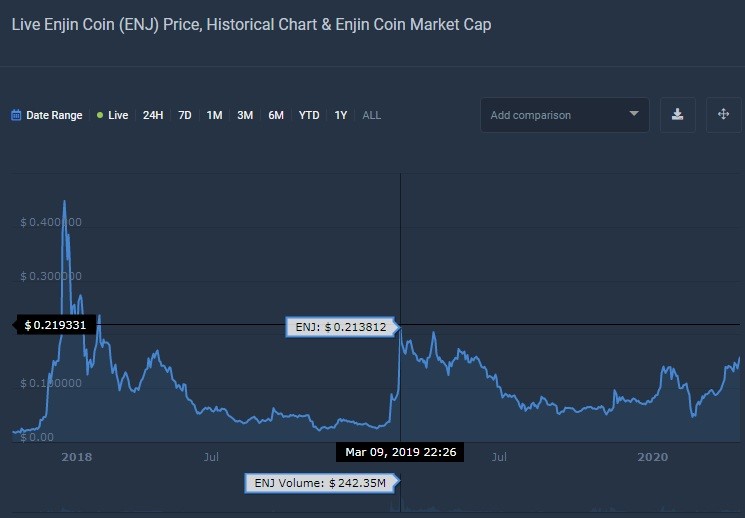
ENJ all-time chart
What traders should like about Enjin Coin is its proclivity to form large price swings to either side, thus presenting a plethora of profit-making opportunities. Notice how promptly the price had reacted to the market collapse by bottoming out and climbing back on top of the 50-period EMA and 99 EMA. This could only mean that the market is inherently bullish as both moving averages had barely crossed to the downside before getting back on the path northward.
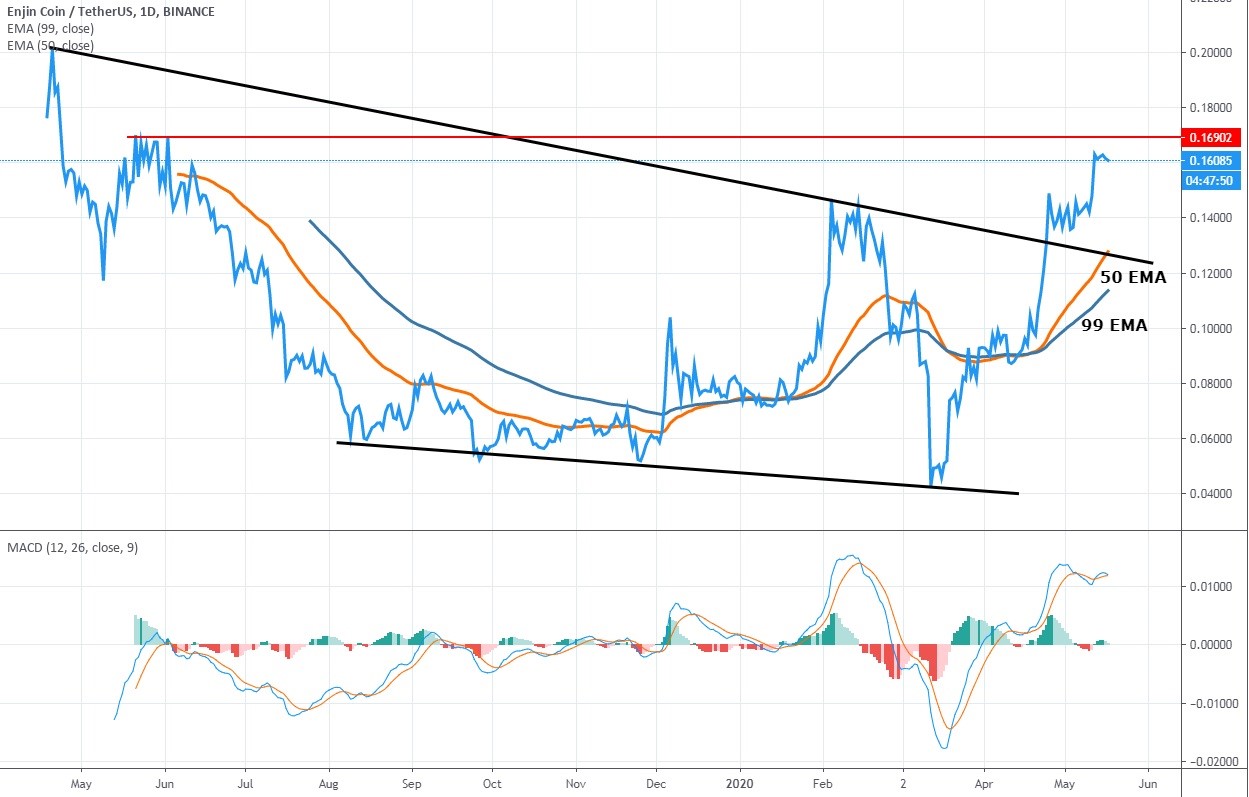
1-year ENJ/USDT chart
The moving averages are going further away from each other, which confirms that the uptrend is gaining momentum. Also, please take note that MACD has set a foothold above 0.01, which is an overbought region, of course, and the presence there hints at the looming retracement. But the fact that the price remains in that zone while the trees on histogram start growing green again shows that the bulls are reigning over this market.
Given such an outlook, we have little doubt that Enjin Coin is on its way to breaching through the resistance at $0.169.
Bearish divergence can’t threaten the uptrend
It is also interesting to note that Enjin Coin barely had any retracements during the ongoing cycle, having been basically going up non-stop. The market has breathed out not so much as to retrace but rather to consolidate briefly and then persist moving to the upside.
That effort might have been required when ENJ had been recovering after the crash and then breaking out of the descending channel. But we are convinced that now Enjin Coin has come to a point where it would require a deeper retracement in order to be able to keep pushing upward.
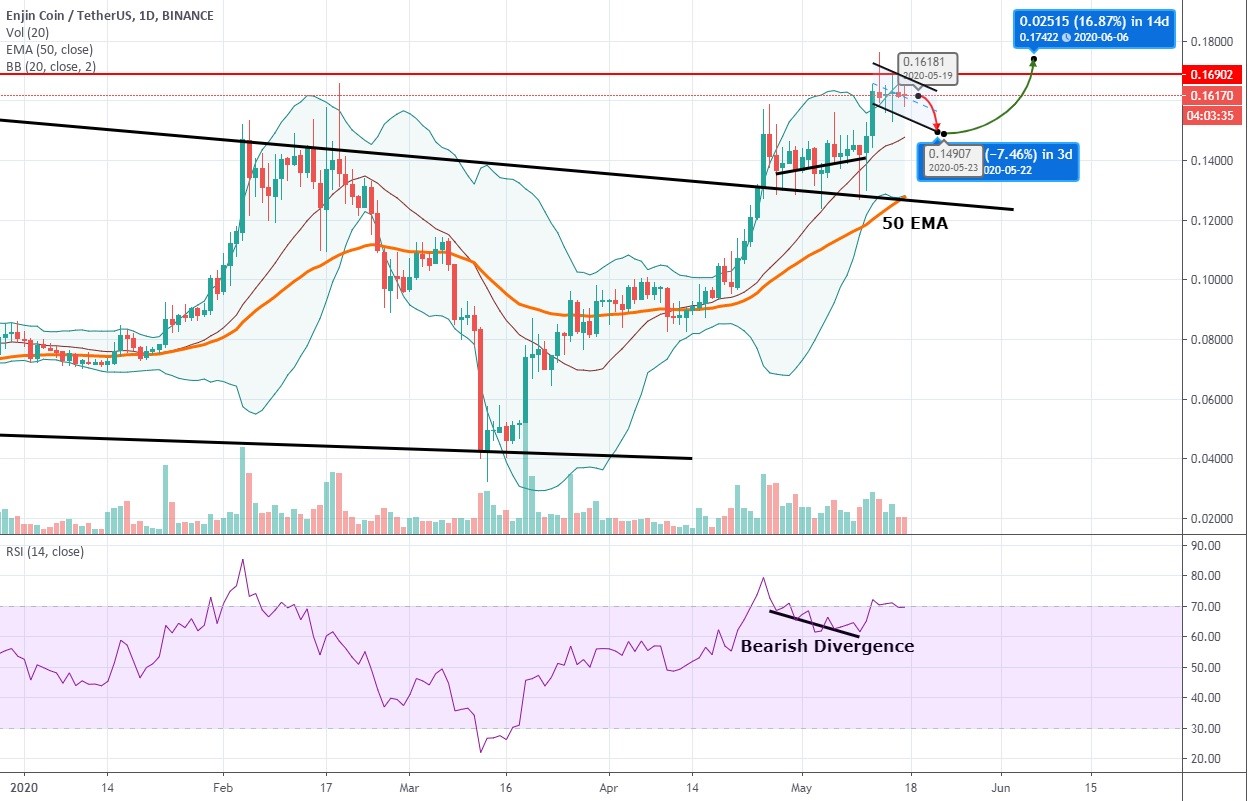
1-day ENJ/USDT chart
The bearish divergence that began to emerge on the 14-period RSI on April 27, and finalized on May 10 indicates that it might be the time to retest the previous resistance. We predict that the price could dive as deep as 21.5%, which would still allow it to remain within the uptrend context. Besides, the bears seem to be eager to defend the resistance at $0.169, at least judging by the increasing thickness of selling volume. Therefore, we wouldn’t recommend setting the stop-loss too tightly to the current resistance at $0.157, because the market can easily stop you out and then reverse in your favor.
The mentioned 21.5% price decrease is probably the worst scenario at the moment, whereas the optimal one provides for Enjin Coin retracing to the middle line of Bollinger Bands or $0.146. Afterward, ENJ will make another attempt at breaking the resistance at $0.169, which will require a 16.8% price increase, with the ultimate price target for the next two weeks being $0.175.
Author: Alex Paulson for Crypto-Rating.com


Top Cryptocurrencies with Price Predictions
| # | Crypto | Prediction | Accuracy | CVIX | Price | 24h | 7d | Market Cap | 7d price change | |
| 1 | Bitcoin predictions | 84% | 26 | $64 296.29 | -3.04% | 4.98% | $1 265 972 828 202 | |||
|---|---|---|---|---|---|---|---|---|---|---|
| 2 | Ethereum predictions | 71.2% | 51 | $3 146.45 | -1.89% | 5.10% | $384 015 180 522 | |||
| 3 | Tether predictions | 90.8% | 1 | $0.999110 | -0.11% | -0.08% | $110 365 184 098 | |||
| 4 | Binance Coin predictions | 87.2% | 18 | $607.81 | 0.02% | 13.23% | $89 705 151 778 | |||
| 5 | Solana predictions | 66.4% | 67 | $149.48 | -4.31% | 10.93% | $66 825 771 805 | |||
| 6 | USD Coin predictions | 94.8% | 2 | $0.999923 | -0.01% | -0.01% | $33 459 056 783 | |||
| 7 | XRP predictions | 68.4% | 61 | $0.531464 | -3.43% | 7.24% | $29 299 136 990 | |||
| 8 | Dogecoin predictions | 73.6% | 57 | $0.153071 | -4.58% | 3.04% | $22 045 488 925 | |||
| 9 | Toncoin predictions | 66.8% | 67 | $5.63 | -0.41% | -8.38% | $19 546 335 578 | |||
| 10 | Cardano predictions | 66% | 63 | $0.478779 | -4.71% | 6.74% | $17 060 787 004 | |||
| 11 | SHIBA INU predictions | 62.4% | 82 | $0.000026 | -2.79% | 17.67% | $15 352 199 741 | |||
| 12 | Avalanche predictions | 69.2% | 63 | $36.86 | -4.07% | 8.15% | $13 933 132 924 | |||
| 13 | Lido stETH predictions | 92.4% | 1 | $2 941.39 | -0.40% | -3.32% | $10 258 752 564 | |||
| 14 | Polkadot predictions | 73.6% | 58 | $7.01 | -3.25% | 5.64% | $10 072 322 406 | |||
| 15 | Wrapped Bitcoin predictions | 86.4% | 26 | $64 272.82 | -3.10% | 4.96% | $9 986 950 080 |