


Tezos (XTZ) Drives Slowly But Resolutely to the Upside
Even though Tezos (XTZ) can’t be dubbed the hardest gainer amongst top altcoins - XTZ is now ranked 18th - the coin for the smart contracts network has had its share of positive price action this year. On the year-to-date time frame, Tezos is 64,8% in the green, which is a far better result than that of Litecoin (LTC) or Ripple (XRP), while its achievement over the past year amounts to 185% in the USD market, and 67.4% against Bitcoin (BTC). On the smaller scale, however, XTZ hasn’t been as impressive, especially when put against the first cryptocurrency: it had only 5.5% to the upside, but lost 14.4% against Bitcoin, mainly due to BTC’s recent 12% rally.
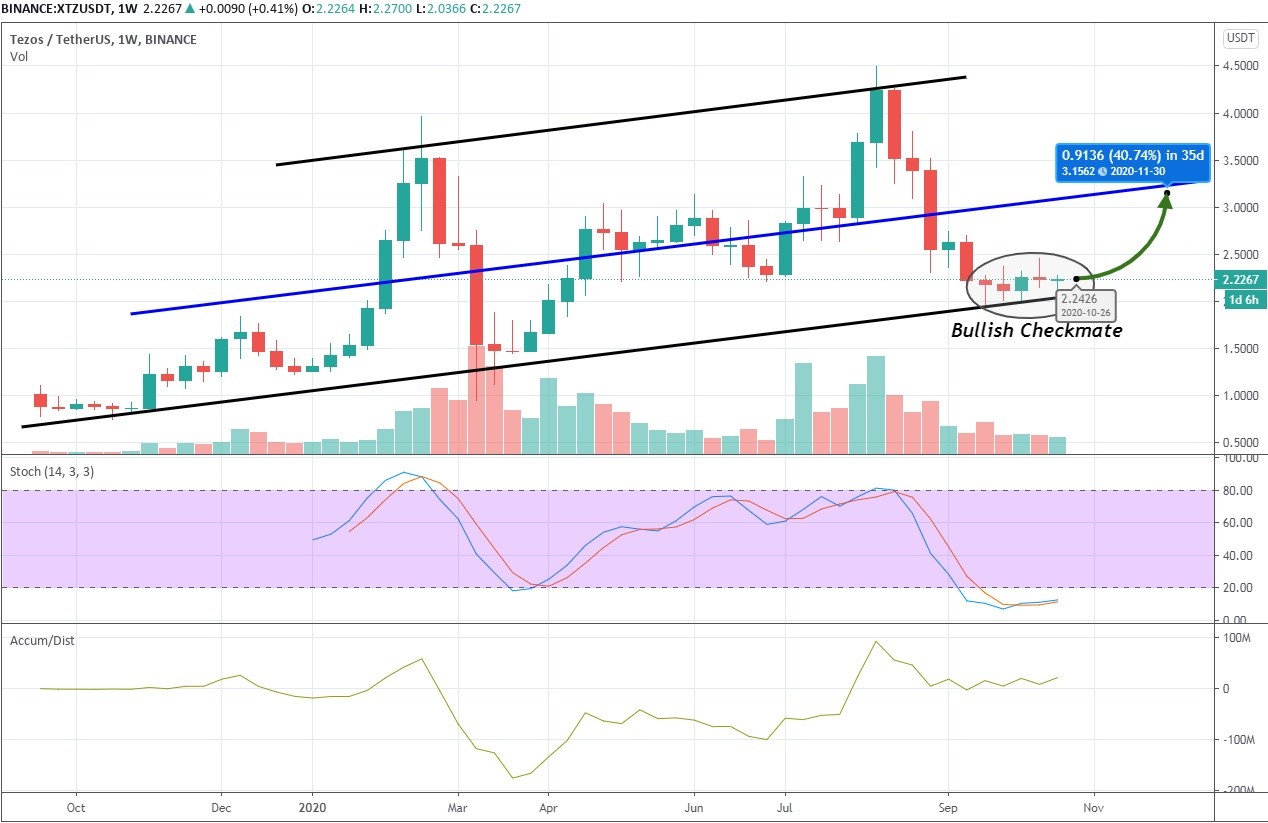
1-week XTZ/USDT chart
Today, the price of Tezos stands at $2.23 after a small 2.12% price appreciation in the past 24 hours. The coin’s market capitalization had been sliding slowly downhill since the middle of August from $3.2 billion, though it has stabilized throughout October at $1,6 billion in conformity with the ongoing consolidation that we see on the weekly chart. Needless to say that the average trading volume hasn’t been fluctuating sharply during the past four weeks, revolving around $120 million, with Binance being the host to the largest trading activity.
Tezos might be on the brink of a bullish rally
When looking at the macro (weekly) time frame, it is clear that something bullish is brewing in this marketplace, judging from how diligently the bulls are protecting the support located around the $2 zone while constantly pushing the close of each next candle slightly higher, gradually shaping up the pattern that appears to be the bullish checkmate. In this situation, the break to the upside would probably occur once the bullish candle, preferably the engulfing one, closes above $2.5 on the backdrop of the rising bullish volume.
Speaking of trading volume, it has obviously been on the decline throughout the consolidation period, but the fact that the bears were unable to pressurize the price beneath the support line despite the predominantly selling volumes speaks in the bulls’ favor.
- Stochastic is down in the oversold zone, having already made a crossing, adding weight to the bullish outlook. The anticipated rally might occur once the indicator goes above 20, confirming the buying momentum;
- The Accumulation/Distribution indicator has been stuck to zero due to consolidation, but it remains positively bullish, meaning that the move to the upside will be supported by the appropriate buying volume.

1-day XTZ/USDT chart
Let’s take a quick look on the daily time frame in order to find the most suitable entry point for a long trade that could potentially bring the 40.7% profit in a little over 30 days. Here we see the Bollinger Bands going slowly for a squeeze that precedes the high volatility period, though it needs to be confirmed by the Average True Range (ATR) indicator, which is currently at the lower extremities. Stochastic here is also flashing bullish. Therefore, the most optimal entry point for the trade would be slightly above $2.48, the new higher high and the point where the price should begin stretching the Bollinger Bands.
Author: Alex Paulson for Crypto-Rating.com


Top Cryptocurrencies with Price Predictions
| # | Crypto | Prediction | Accuracy | CVIX | Price | 24h | 7d | Market Cap | 7d price change | |
| 1 | Bitcoin predictions | 87.2% | 23 | $64 742.01 | 0.64% | 1.77% | $1 274 780 684 025 | |||
|---|---|---|---|---|---|---|---|---|---|---|
| 2 | Ethereum predictions | 72.4% | 51 | $3 172.49 | 0.83% | 3.31% | $387 195 965 458 | |||
| 3 | Tether predictions | 94% | 1 | $1.000151 | 0.10% | -0.03% | $110 480 177 546 | |||
| 4 | Binance Coin predictions | 85.2% | 20 | $613.50 | 0.94% | 11.20% | $90 545 078 851 | |||
| 5 | Solana predictions | 63.2% | 71 | $147.24 | -1.60% | 4.31% | $65 823 089 907 | |||
| 6 | USD Coin predictions | 90.8% | 2 | $1.000116 | 0.02% | 0.01% | $33 249 140 497 | |||
| 7 | XRP predictions | 68% | 62 | $0.529314 | -0.40% | 5.30% | $29 180 648 027 | |||
| 8 | Dogecoin predictions | 68% | 60 | $0.153170 | 0.05% | 0.04% | $22 061 749 961 | |||
| 9 | Toncoin predictions | 69.6% | 66 | $5.50 | -2.44% | -15.91% | $19 105 766 327 | |||
| 10 | Cardano predictions | 66% | 72 | $0.477005 | -0.38% | 4.34% | $16 997 547 087 | |||
| 11 | SHIBA INU predictions | 62.4% | 82 | $0.000026 | 0.41% | 14.42% | $15 421 640 594 | |||
| 12 | Avalanche predictions | 64% | 68 | $36.13 | -2.09% | 2.94% | $13 663 299 708 | |||
| 13 | TRON predictions | 88% | 21 | $0.117251 | 3.17% | 7.44% | $10 267 623 783 | |||
| 14 | Lido stETH predictions | 91.2% | 1 | $2 941.39 | -0.40% | -3.32% | $10 258 752 564 | |||
| 15 | Wrapped TRON predictions | 85.2% | 19 | $0.117125 | 3.03% | 7.70% | $10 256 553 245 |