


Stratis (STRAT) Gets Bullish After Consolidation
Although the year 2019 wasn’t exactly fruitful for Stratis (STRAT), as it lost 46% of its dollar value, and more than 30% of its worth in two chief cryptocurrencies, Bitcoin and Ethereum, the period that followed the COVID-19 market crash is shaping up to become a probable trend reversal. However, the coin still has a lot more to gain before it encounters the first major barrier at the high of the previous year that stands at $1, recorded on July 27, 2019.
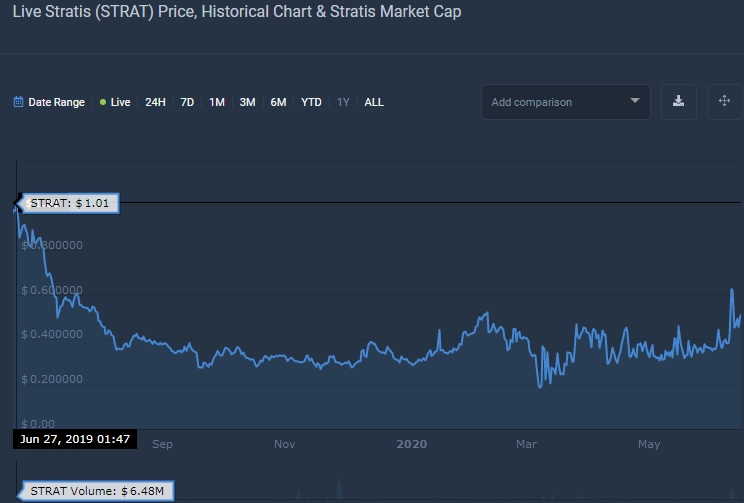
1-year Stratis price chart
The chart above pinpoints another crucial area of price action located at $0.4, which had served as a local high before the current price action broke it after a series of tests, and now seeks to either confirm it as a support or leave this level behind altogether.
Basically, STRAT is now in the situation where it needs to stay above the designated support line in order to:
- Maintain the present bullish sentiment in the market;
- Convert a healthy price action into further gains because there are virtually no impenetrable resistance levels left before the STRAT’s ultimate goal for this cycle, which is reaching and surpassing the $1 level.
Before now, Stratis had had a very extensive period of consolidation that lasted from August 2019 until around June 3, when STRAT made a decisive push to the upside and beat the resistance.
The current situation in the USDT market
As already mentioned, Stratis took a bit of time to properly recover from the aftermath of Black Thursday, although it did make a strong initial push in the week after the crash, with the upper wick of a failed breakout candle only briefly penetrating the ultimate recovery zone at $0.33. Also, notice a weird morning star pattern that emerged at the top of the first retracement wave, which must have led plenty of traders into a trap since it has actually served as a bullish reversal pattern. Therefore, this market is capable of producing irregular patterns that could act in contrast to their textbook meaning.
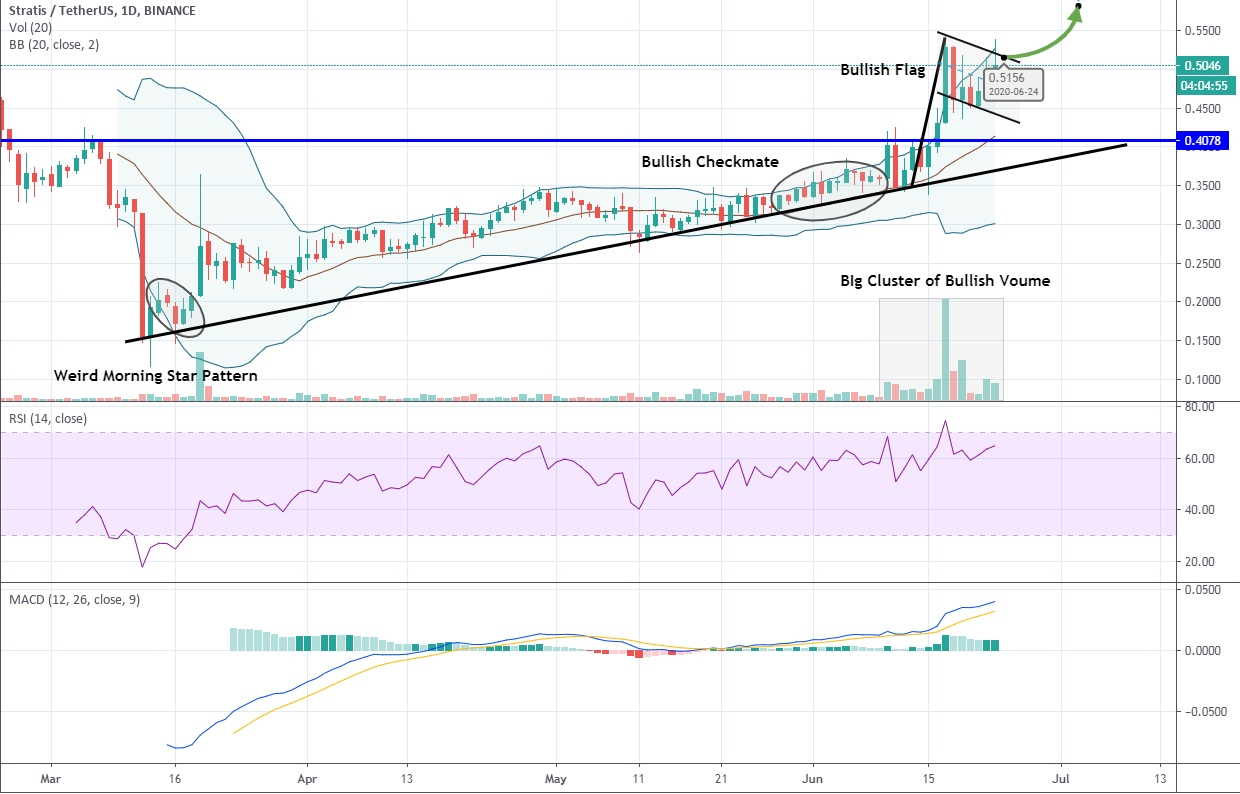
1-day STRAT/USDT chart
Right now, the altcoin is set to resolve the current bullish flag to the upside, possibly even in the three white soldiers formation that will further confirm the bulls’ intention to take the price to $1.
The trading volume profile reveals an enormous cluster of buying volume, which signifies the growing traders’ interest towards STRAT that will ultimately translate into substantial gains of no less than 20% in the next six weeks. After the last pullback, we see that the bullish volume is again on the rise, so traders might witness a breakout above $0.55 in eight to ten days.
All key indicators are also significantly bullish on Stratis, which could be interpreted as a strong signal to buy at the break of the bullish flag.
The RSI is in a strong uptrend, showing no bearish divergences that could influence the price negatively. Right now, the indicator is at 65 in the upper neutral zone;
MACD is insistently bullish thanks to the extensive green histogram and the widening signal lines that head towards 50;
ATR also heads north after consolidation, currently sitting just below 0.005, crooking upward.
To summarize, the next couple of weeks are shaping up to be bullish for Stratis, and now might be an appropriate time to go long here, as the risk/reward ratio is about 1:5.
Author: Alex Paulson for Crypto-Rating.com

Top Cryptocurrencies with Price Predictions
| # | Crypto | Prediction | Accuracy | CVIX | Price | 24h | 7d | Market Cap | 7d price change | |
| 1 | Bitcoin predictions | 84.4% | 25 | $64 271.38 | -3.73% | 5.15% | $1 265 496 450 332 | |||
|---|---|---|---|---|---|---|---|---|---|---|
| 2 | Ethereum predictions | 76.4% | 49 | $3 157.43 | -3.05% | 6.22% | $385 358 557 927 | |||
| 3 | Tether predictions | 92% | 1 | $0.999852 | -0.02% | -0.04% | $110 447 216 461 | |||
| 4 | Binance Coin predictions | 85.6% | 18 | $606.93 | 0.03% | 10.61% | $89 575 802 259 | |||
| 5 | Solana predictions | 67.6% | 71 | $147.40 | -6.86% | 12.67% | $65 893 442 380 | |||
| 6 | USD Coin predictions | 91.2% | 2 | $1.000087 | 0.01% | 0.02% | $33 443 613 205 | |||
| 7 | XRP predictions | 72% | 62 | $0.527628 | -4.06% | 6.49% | $29 087 702 292 | |||
| 8 | Dogecoin predictions | 72.8% | 60 | $0.151351 | -6.56% | 2.44% | $21 798 428 537 | |||
| 9 | Toncoin predictions | 66% | 66 | $5.47 | -7.58% | -7.01% | $19 006 158 758 | |||
| 10 | Cardano predictions | 65.2% | 72 | $0.477013 | -6.07% | 7.91% | $16 997 831 280 | |||
| 11 | SHIBA INU predictions | 64% | 82 | $0.000025 | -7.12% | 14.30% | $14 877 091 584 | |||
| 12 | Avalanche predictions | 67.6% | 66 | $35.76 | -9.52% | 3.68% | $13 516 558 275 | |||
| 13 | Lido stETH predictions | 94.4% | 1 | $2 941.39 | -0.40% | -3.32% | $10 258 752 564 | |||
| 14 | Polkadot predictions | 70.8% | 64 | $6.96 | -6.08% | 4.48% | $10 002 091 467 | |||
| 15 | Wrapped TRON predictions | 86.8% | 19 | $0.114186 | 0.76% | 4.40% | $9 999 796 730 |