


NEM (XEM): The Buyers Are Flexing Their Muscles
Although NEM (XEM) looks absolutely pitiful on the historical chart as the all-time high remains 94% away from the current zone of price action, located around $0.12, the year 2020 has so far proven to be quite fruitful for the 21st cryptocurrency.

XEM all-time chart
- As things stand, NEM has a decent chance of closing the year in the green across all three major markets, which is something that a battered altcoin hasn’t seen in a long time since the commencement of crypto winter in 2018.
- 203.9% - the gain against USD over the past twelve months;
- 80.13% - significant progress has also been made in the Bitcoin (BTC) market, even though NEM has little to do with DeFi, the main driver behind this year’s altseason;
- 26.67% - the performance against Ethereum (ETH), inarguably the strongest out of the top altcoins, suggests that XEM might be on a path to resurrection after a prolonged slump.
The minor uptrend in the making
As usual, the XEM price analysis starts with the macro (monthly) time frame, where the altcoin has actually been making significant strides over the course of the past few months, namely an enormous 213% explosive move to the upside that occurred in August.

1-month XEM/USDT chart
That particular move had helped XEM to break out of $0.96, the area of resistance, as well as immense psychological importance. Once the level was broken, NEM rallied to $0.17, consequently establishing the two-year high and encountering strong resistance at the level that stems from the 2017/2018 price action.
After being hit with the correction, XEM had rolled back to the former resistance - now support - at $0.96 and began forming what appears to be the descending triangle. Even though this particular triangle is commonly perceived as bearish, the bullish price action during the current month suggests that it’s highly likely to be broken to the upside soon.
Key price levels:
- $0.096 - the crucial area of support which buyers have to defend in order to maintain the positive dynamic;
- $0.13 - the resistance of the descending triangle, the breach of which will provide a signal of uptrend continuation.
The weekly chart provides us with an even clearer picture of how aggressive the buyers have been this month.
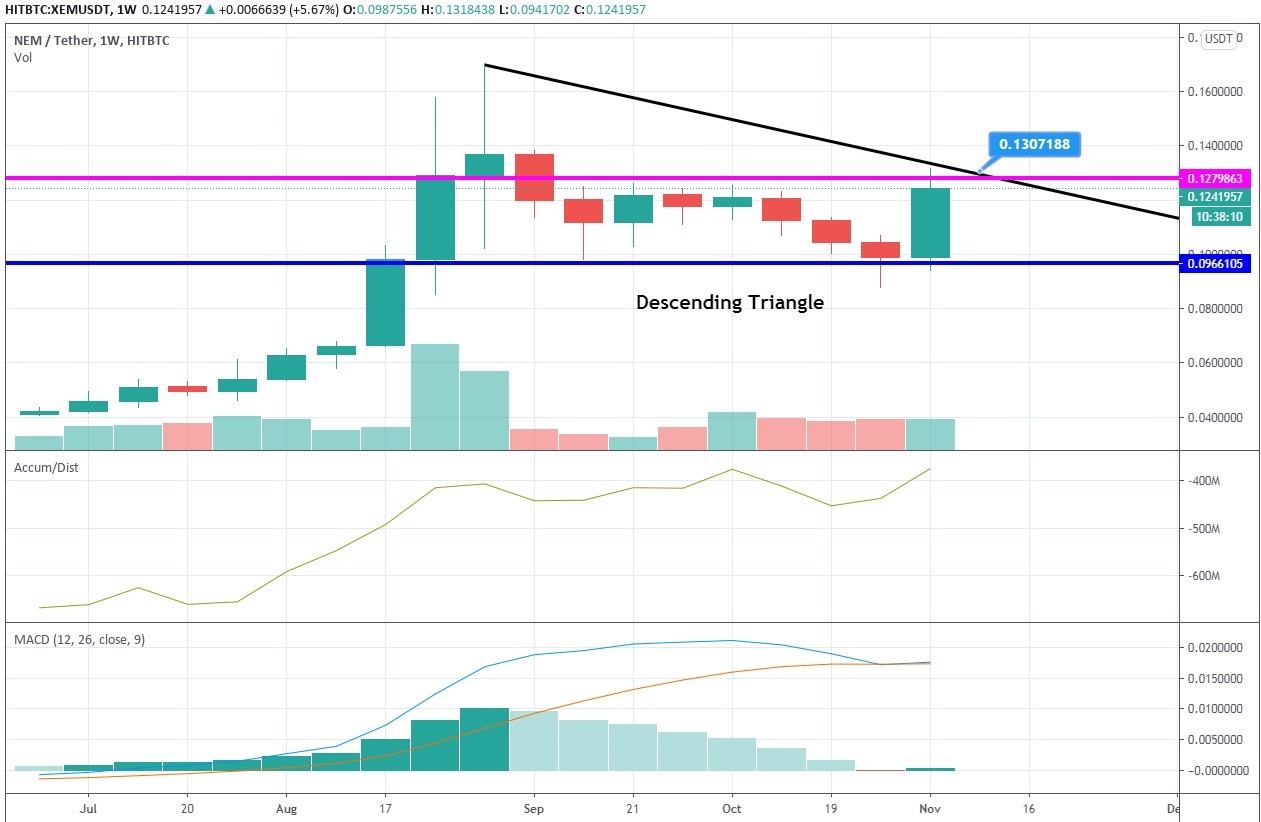
1-week XEM/USDT chart
If the current bullish candle closes above $0.126, it would engulf the seven weeks’ worth of price action and offer a strong XEM buy signal that is likely to be supported by MACD, which still hasn’t crossed the signal line to the downside and flashes a green histogram. The Accumulation/Distribution indicator has got back to the highest extremities, thus supporting the notion of the persisting uptrend.
Key price levels:
- $0.126 - the close of the bullish candle above that level will provide an early signal about the preparing rally.
The daily time frame reveals that NEM has already tested the resistance of the descending triangle but to no avail. Afterward, it was rejected back to the current support at $0.117.

1-day XEM/USDT chart
A successful defense of that support level increases the possibility of shallow retracement that might ultimately lead to the uptrend continuation. But should buyers prove incapable of setting a foothold above $0.126, a narrower consolidation will follow.
Author: Alex Paulson for Crypto-Rating.com


Top Cryptocurrencies with Price Predictions
| # | Crypto | Prediction | Accuracy | CVIX | Price | 24h | 7d | Market Cap | 7d price change | |
| 1 | Bitcoin predictions | 80.4% | 27 | $64 155.50 | 2.73% | -5.06% | $1 263 066 455 009 | |||
|---|---|---|---|---|---|---|---|---|---|---|
| 2 | Ethereum predictions | 78% | 45 | $3 062.08 | 2.00% | -6.04% | $367 670 741 455 | |||
| 3 | Tether predictions | 92.4% | 1 | $1.000437 | -0.01% | 0.02% | $109 517 365 626 | |||
| 4 | Binance Coin predictions | 85.6% | 18 | $559.80 | 2.68% | -5.64% | $83 709 375 883 | |||
| 5 | Solana predictions | 71.2% | 51 | $144.14 | 3.48% | -6.58% | $64 402 586 048 | |||
| 6 | USD Coin predictions | 91.6% | 2 | $1.000003 | -0.01% | 0% | $33 903 068 496 | |||
| 7 | XRP predictions | 68.4% | 58 | $0.512182 | 4.63% | -6.51% | $28 236 143 262 | |||
| 8 | Dogecoin predictions | 70.4% | 60 | $0.156630 | 5.33% | -10.03% | $22 548 280 909 | |||
| 9 | Toncoin predictions | 66.4% | 64 | $6.11 | -9.85% | -10.45% | $21 207 802 773 | |||
| 10 | Cardano predictions | 72% | 60 | $0.482345 | 7.87% | -5.22% | $17 183 386 742 | |||
| 11 | SHIBA INU predictions | 58.4% | 85 | $0.000023 | 5.13% | -5.50% | $13 666 465 959 | |||
| 12 | Avalanche predictions | 68% | 60 | $35.77 | 5.13% | -7.82% | $13 520 909 779 | |||
| 13 | Lido stETH predictions | 90.8% | 1 | $2 941.39 | -0.40% | -3.32% | $10 258 752 564 | |||
| 14 | Wrapped Bitcoin predictions | 81.2% | 31 | $64 102.16 | 2.66% | -5.19% | $9 960 432 922 | |||
| 15 | Polkadot predictions | 70% | 57 | $6.77 | 3.06% | -6.72% | $9 724 497 698 |