


Litecoin (LTC): The Downtrend Continues
The recent DeFi boom marked the emergence of such cryptocurrencies as Polkadot (DOT) and Chainlink (LINK), which has already superseded the Digital Silver in the top 10 rankings. Right now, Litecoin rests in 10th place, having experienced a sizable market capitalization drop from $4,4 billion to the current $3 billion. The average trading volume over the past 30 days reduced from $2.3 billion to $1.1 billion, marking the further loss of interest towards this currency from market participants. The largest trading volume of late was recorded on August 17. On that day, LTC traded between $68,52 (high) and $61,88 (close) - keep that price area in mind because Litecoin might return there during the next episode of bullish price action.
Litecoin Locked in the range with a bearish outlook
The altcoin continues to disappoint the holders as it has been steadily losing value: -17% (USD), - 37% (BTC), and - 60% (ETH). LTC’s poor performance was aggravated by the recent market drop that slashed 23% off its dollar value. Right now, Litecoin is traded at $46.3, with the 24-hour price range being between $45.36 and $46.40 that provided a small 1.1% spike to the upside.
The analysis of price action on the year-to-date chart tells that the sellers are actively forcing the price to the multi-month support line that runs at $40. Before that, the bears had shattered the fledgling uptrend right when the price was aiming for another higher high - the previous one stood at $67.25.

Year-to-date LTC chart
The current chapter of price action, which began in September, sees Litecoin being packaged inside the range between $40 and $50, where it had been consolidating for several months before the breakout to $60. Given that the entire cryptocurrency market has turned bearish over the past three weeks, LTC won’t experience any significant spikes to the upside in the next eight to ten weeks but will get locked inside the designated range instead, so make sure to use the appropriate trading tactics.
The weekly chart shows that Litecoin remains in the perpetual downtrend ever since it reached $144 after the hype around the halving. The price is now seeking the lower low after making the lower high at $70.47.
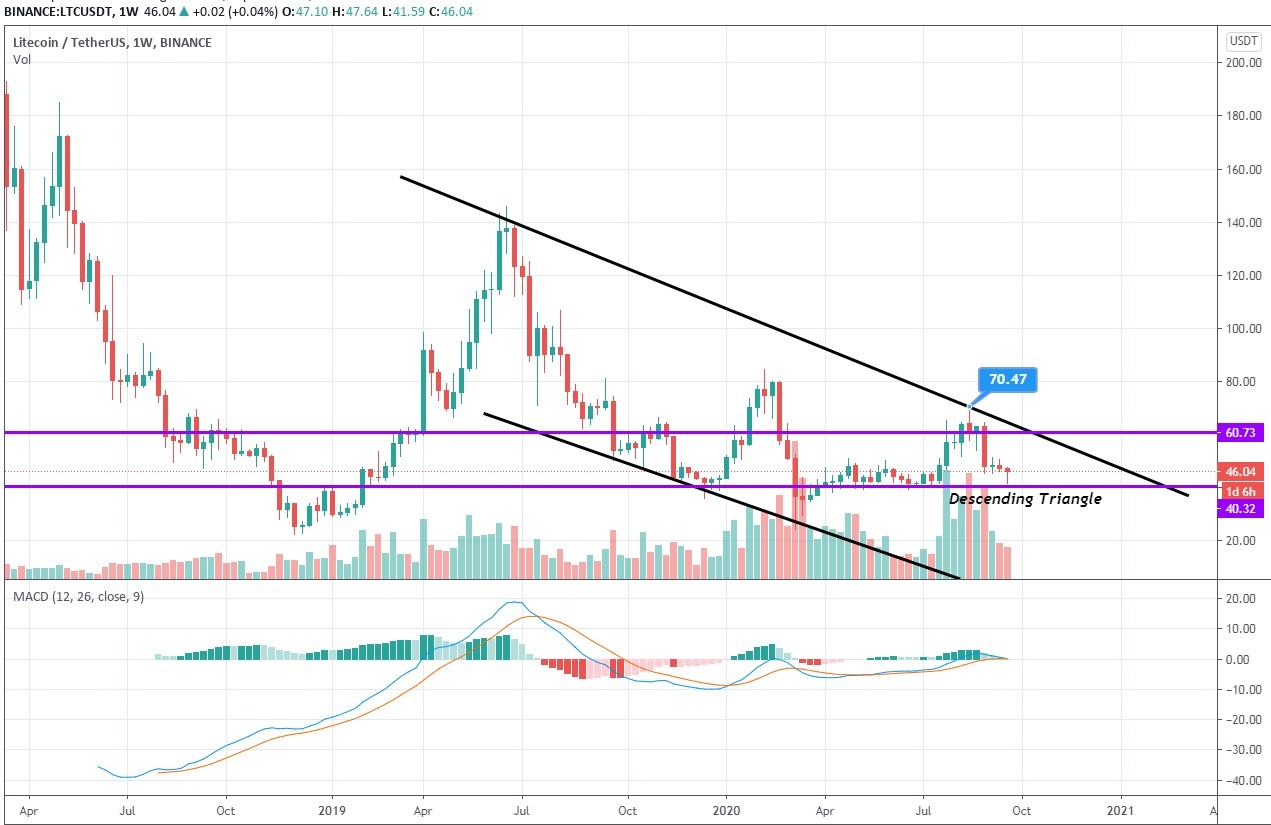
1-week LTC/USDT chart
As we established earlier, LTC is likely to go in the range with $40 playing the role of reliable support for the next five to ten days. However, Litecoin also finds itself trapped inside the descending triangle, a bearish pattern that generally resolves to the downside. Therefore, if the cryptocurrency market persists being bearish or just stagnant throughout the fall, traders might see LTC falling through the floor and landing somewhere near the $20 level.
In the developments on the weekly time frame, Litecoin made a short rebound from the interim support level at $42,45, and now, it could either get rejected at $46.9 or travel higher to $51.40 and then get thrown off the edge of the range.

1-day LTC/USDT chart
Here MACD displays an intention to make a bullish crossover that should be confirmed if the price breaks above $46.9. In that case, it would be possible to trade on the breakout with the price target being set in the $50 area.
Author: Alex Paulson for Crypto-Rating.com


Top Cryptocurrencies with Price Predictions
| # | Crypto | Prediction | Accuracy | CVIX | Price | 24h | 7d | Market Cap | 7d price change | |
| 1 | Bitcoin predictions | 82% | 30 | $64 810.63 | 4.67% | -8.44% | $1 275 925 282 991 | |||
|---|---|---|---|---|---|---|---|---|---|---|
| 2 | Ethereum predictions | 75.6% | 40 | $3 100.72 | 3.05% | -12.11% | $372 314 125 224 | |||
| 3 | Tether predictions | 92.4% | 1 | $1.000689 | 0.05% | 0.10% | $109 544 941 532 | |||
| 4 | Binance Coin predictions | 86% | 22 | $559.36 | 3.23% | -10.14% | $83 643 562 047 | |||
| 5 | Solana predictions | 76% | 49 | $145.02 | 9.16% | -15.63% | $64 795 895 793 | |||
| 6 | USD Coin predictions | 95.2% | 2 | $1.000093 | 0% | 0.02% | $33 169 858 184 | |||
| 7 | XRP predictions | 75.6% | 52 | $0.501078 | 2.10% | -17.65% | $27 623 985 647 | |||
| 8 | Toncoin predictions | 66.8% | 61 | $7.14 | 15.47% | -0.54% | $24 784 328 204 | |||
| 9 | Dogecoin predictions | 70.4% | 60 | $0.152751 | 4.27% | -23.72% | $21 988 244 632 | |||
| 10 | Cardano predictions | 70.4% | 56 | $0.465540 | 4.48% | -20.46% | $16 584 719 942 | |||
| 11 | SHIBA INU predictions | 62.8% | 85 | $0.000023 | 4.18% | -17.16% | $13 453 928 548 | |||
| 12 | Avalanche predictions | 70.4% | 63 | $35.43 | 4.77% | -23.63% | $13 393 936 112 | |||
| 13 | Lido stETH predictions | 96% | 1 | $2 941.39 | -0.40% | -3.32% | $10 258 752 564 | |||
| 14 | Wrapped Bitcoin predictions | 82.4% | 30 | $64 682.12 | 4.82% | -8.56% | $10 050 549 600 | |||
| 15 | Polkadot predictions | 75.2% | 53 | $6.83 | 3.17% | -18.85% | $9 808 303 913 |