


ICON (ICX) Is Being Dragged to the Downside
Even though ICON (ICX) is still lying mostly flat on the macro scale, the last year turned out to be productive for the altcoin that backs the blockchain solution for interoperability as its USD value increased by 124%, while it also broke away from Bitcoin by 98.3%.
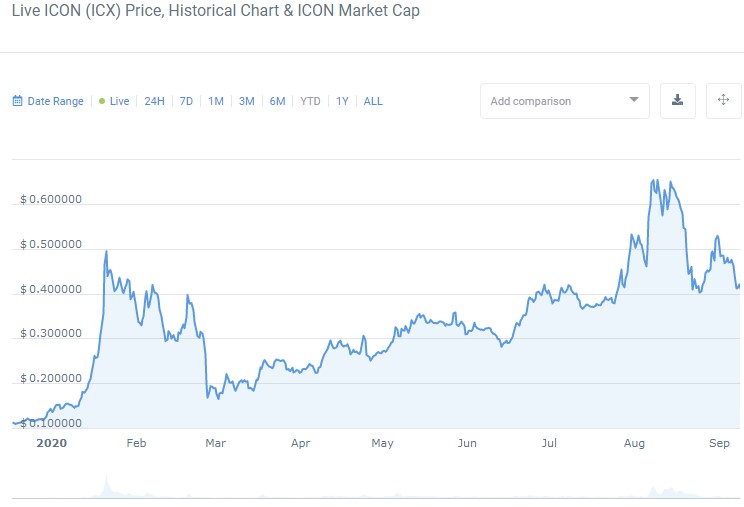
Year-to-date ICX chart
ICON's price action has been erratic since the beginning of the year, with two large rallies and a prolonged period of a calm uptrend. It's interesting to note that ICON has proven unable to hold the price level after large spikes to the upside, which results in significant drops, like the ones that happened in March and September. Nevertheless, the chart has clearly defined higher lows and higher highs even at the times of market crisis, which speaks of ICON's resilience to bearish pressure. But the autumn is so far proving to be bearish for the cryptocurrency market in general that might reflect negatively on the ICX market, too.
Staying inside the rising channel is key for ICON
On the weekly time frame, we see some distinctive signs of downtrend reversal, although the latest price drop forced the price beneath the important support line at $0.45 after getting rejected at $0.6.
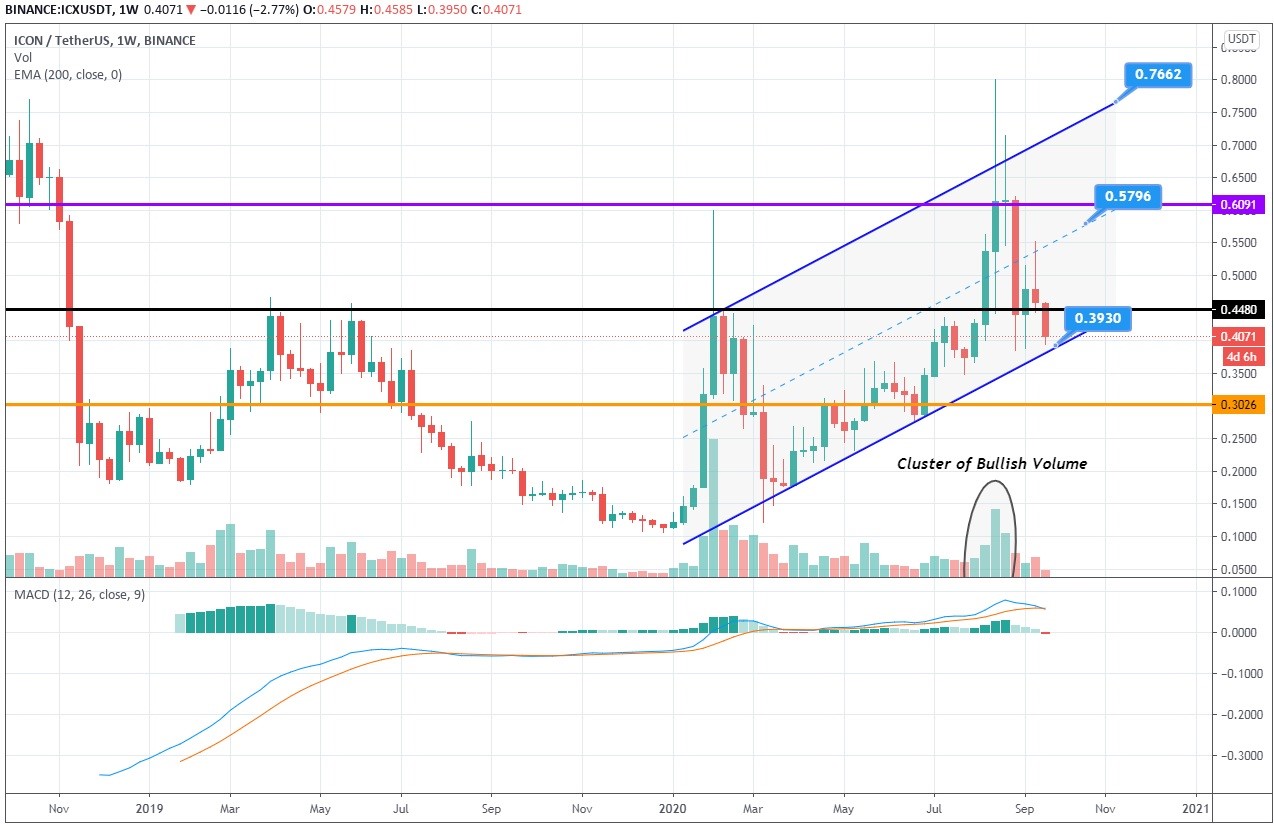
1-week ICON/USDT chart
The level at $0.39 appears as a lucrative spot to buy the dip, though traders should take the bearish signals from MACD into consideration when placing a trade. The oscillator's moving averages are the closest they have been to making a bearish crossover since June. This time around, the histogram has also begun turning red, indicative of the growing bearish momentum. However, the large cluster of buying volume that emerged during the last upswing increases the chance of reversal at $0.39 and a push either to the interim resistance at $0.57 or all the way to $0.76, which constitutes the most bullish mid-term scenario. But in order for this scenario to play out, the cryptocurrency market must restore the bullish agenda, which might be achieved through the influx of capital following the issuance of the second stimulus package by the Fed and the subsequent reinstatement of the altseason.
The daily chart reveals that the pressure coming from the sellers has already forced the price beneath the 50 EMA, the deepest it's been since March. Another nudge to the downside will make the price test the 200 EMA, thus questioning the ability of buyers to withstand that pressure.
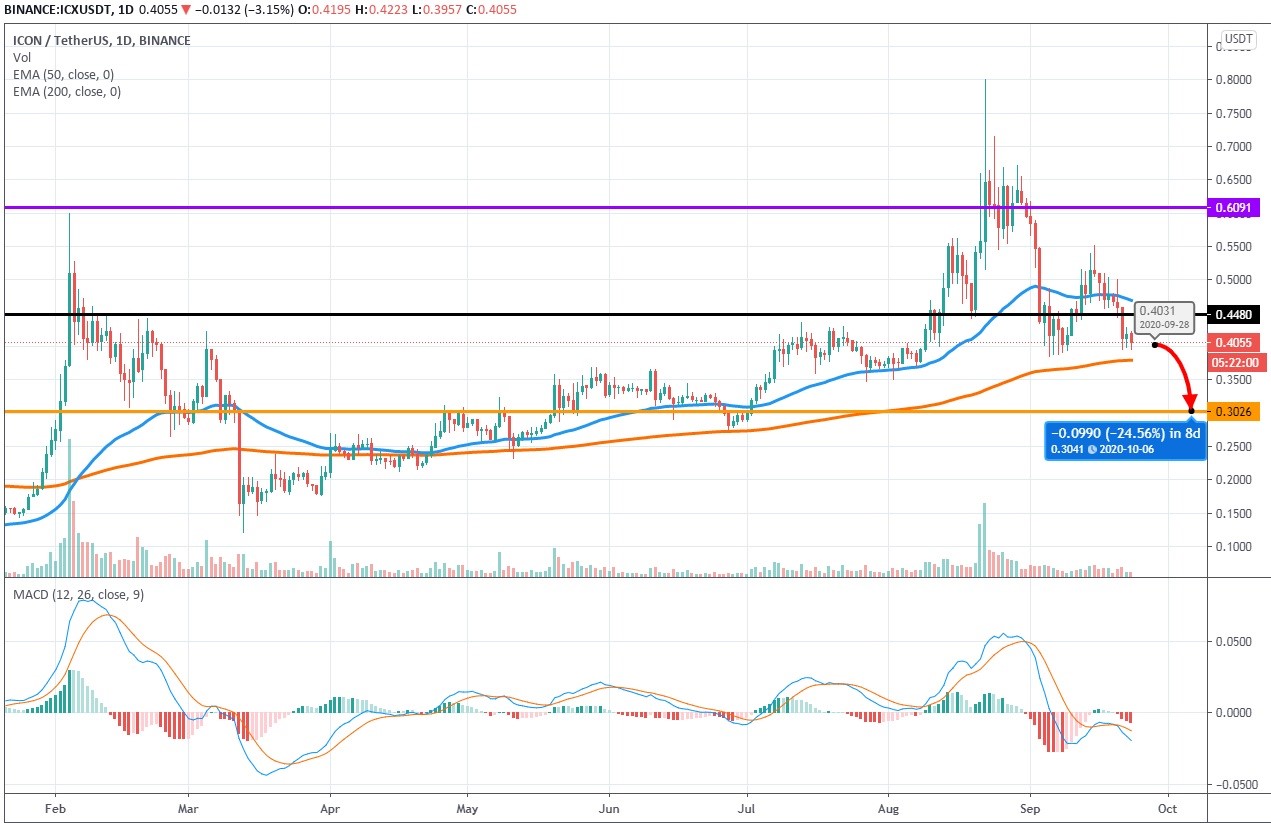
1-day ICON/USDT chart
The fact that MACD had denied the bullish crossover right when the price was trying to recover above the 50 EMA signals about the beginning of realization of the bearish scenario that sees the price sliding to $0.3 and, consequently, underneath the 200 EMA, while MACD will travel to the oversold extreme at -0.05. The neutral scenario sees ICON being squeezed between the 200 EMA and $0.45 for some consolidation that could lead to the emergence of the descending triangle pattern, which usually has a bearish bias.
All in all, our ICON price prediction is that the price will see the 24.5% decline in the next three weeks that would pose a threat to the long-standing uptrend. It is important to watch how the price behaves once it's beneath the 200 EMA.
Author: Alex Paulson for Crypto-Rating.com


Top Cryptocurrencies with Price Predictions
| # | Crypto | Prediction | Accuracy | CVIX | Price | 24h | 7d | Market Cap | 7d price change | |
| 1 | Bitcoin predictions | 84.8% | 28 | $62 166.63 | -0.26% | -12.32% | $1 223 811 543 668 | |||
|---|---|---|---|---|---|---|---|---|---|---|
| 2 | Ethereum predictions | 78.4% | 38 | $3 021.89 | -0.26% | -15.22% | $362 844 737 420 | |||
| 3 | Tether predictions | 93.6% | 1 | $1.000473 | 0% | 0.06% | $109 083 490 898 | |||
| 4 | Binance Coin predictions | 84.8% | 26 | $541.63 | 1.00% | -9.94% | $80 992 044 932 | |||
| 5 | Solana predictions | 78.8% | 42 | $133.34 | 1.02% | -22.49% | $59 562 610 075 | |||
| 6 | USD Coin predictions | 94% | 2 | $1.000021 | 0% | 0.01% | $32 713 397 968 | |||
| 7 | XRP predictions | 76.8% | 44 | $0.491523 | 0.88% | -19.96% | $27 092 682 094 | |||
| 8 | Toncoin predictions | 72% | 54 | $6.13 | -0.65% | -17.27% | $21 265 697 942 | |||
| 9 | Dogecoin predictions | 72.4% | 60 | $0.146176 | -3.79% | -24.59% | $21 039 824 386 | |||
| 10 | Cardano predictions | 71.6% | 51 | $0.446354 | 0.46% | -23.86% | $15 899 566 615 | |||
| 11 | SHIBA INU predictions | 60.4% | 85 | $0.000022 | 1.29% | -20.03% | $13 024 503 291 | |||
| 12 | Avalanche predictions | 68.4% | 65 | $34.28 | 2.09% | -26.01% | $12 955 988 077 | |||
| 13 | Lido stETH predictions | 91.6% | 1 | $2 941.39 | -0.40% | -3.32% | $10 258 752 564 | |||
| 14 | Wrapped Bitcoin predictions | 83.2% | 30 | $62 048.53 | -0.51% | -12.39% | $9 641 332 103 | |||
| 15 | Wrapped TRON predictions | 89.2% | 14 | $0.108575 | -3.17% | -9.17% | $9 512 970 254 |