


Holo (HOT): The Uptrend is Hanging In the Balance
After the market meltdown in March had taken Holo (HOT) to the all-time low at $0.00022, the token that represents the blockchain platform for dApps with an interesting consensus-reaching mechanism has had the strongest and the most prolonged bull rally in months.
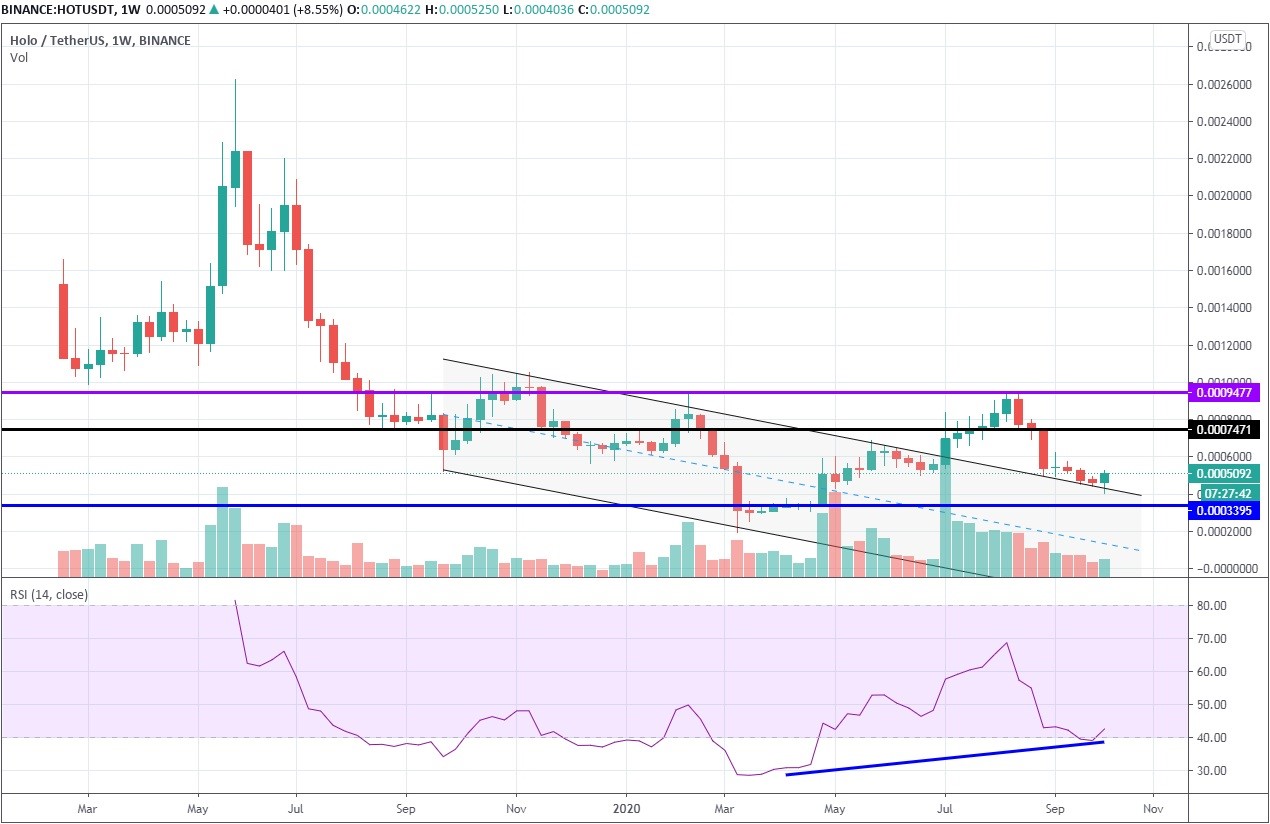
1-week HOT/USDT chart
This rally led to the price breaking out of the downward channel that was marking the confines of the downtrend that guaranteed the increased interest from the buyers, which, in turn, entailed another five weeks of uninterrupted bullish price action. However, the gradually decreasing trading volume should have warned traders that the buyers don’t have enough strength to carry the price to the psychological level at $0.0012, which could have been a good price target in a fledgling uptrend, and that the upward price flow was about to reverse.
Is HOT going back inside the falling channel?
Holo began retracing in the middle of August from the price level at $0.00094. At first, it appeared as another shallow retracement before the continuation of the uptrend, but then came the September selloff, which caused HOT to lose 55.6% of its USDT value in just 49 days.
But what’s fascinating about the recent developments in this market is how well the buyers were able to hold onto the support provided by the upper line of the falling channel, which allowed to preserve the bullish outlook for this market on the macro level.
Obviously, it is of immense importance for the buyers to keep the price above $0.0005, even if it would be in the form of consolidation. This scenario is supported by RSI, which follows the price action without visible divergences, since it appears to have bounced off the support line right at the edge of the oversold area in sync with the price that got the 9% bump to the upside in the past 24 hours.
On this time frame, we have picked out four crucial levels of price interaction that will determine the future developments in this market.
- $0.00044 - the current support level that has to be maintained if the buyers are planning the reversal;
- $0.00033 - the first support level that 0x will meet if the sellers prevail and knock the price back inside the descending channel. It corresponds with the price levels seen in March;
- $0.00074 - the conservative price target for those traders who are willing to risk going long on ZRX now. It also served as the initial support level during the previous two reversals;
- $0.00094 - the multi-month resistance level that can be dubbed as the borderline between the bearish and the bullish phases of trend development. HOT needs to break above that level to confirm its bullish intentions. Otherwise, it would be the fourth failed attempt in a span of a year (the fourth top) that could discourage the big buyers from entering this market and supporting the Holo’s strive to the upside.
To summarize, HOT still holds the promise of uptrend continuation, but first, it needs to pull itself away from the upper channel line. Watch out for the engulfing bullish candle to enter a long trade.
Author: Alex Paulson for Crypto-Rating.com


Top Cryptocurrencies with Price Predictions
| # | Crypto | Prediction | Accuracy | CVIX | Price | 24h | 7d | Market Cap | 7d price change | |
| 1 | Bitcoin predictions | 86.8% | 21 | $62 777.23 | -1.17% | -9.11% | $1 235 741 063 758 | |||
|---|---|---|---|---|---|---|---|---|---|---|
| 2 | Ethereum predictions | 83.6% | 30 | $3 059.34 | -1.54% | -13.04% | $367 336 292 565 | |||
| 3 | Tether predictions | 94.8% | 1 | $1.000390 | 0% | 0.07% | $108 142 272 293 | |||
| 4 | Binance Coin predictions | 85.2% | 16 | $535.38 | -3.81% | -7.75% | $80 057 320 062 | |||
| 5 | Solana predictions | 74% | 43 | $132.22 | -4.58% | -24.17% | $59 064 198 087 | |||
| 6 | USD Coin predictions | 92% | 2 | $1.000148 | 0.02% | 0% | $32 541 399 313 | |||
| 7 | XRP predictions | 81.2% | 31 | $0.491910 | -1.35% | -21.21% | $27 114 048 131 | |||
| 8 | Dogecoin predictions | 70.8% | 60 | $0.153226 | -4.26% | -18.95% | $22 051 237 993 | |||
| 9 | Toncoin predictions | 72.8% | 53 | $6.07 | -10.02% | -9.35% | $21 072 373 464 | |||
| 10 | Cardano predictions | 75.6% | 49 | $0.449300 | -1.62% | -25.08% | $16 001 649 489 | |||
| 11 | SHIBA INU predictions | 59.6% | 85 | $0.000022 | 1.51% | -19.78% | $13 101 990 254 | |||
| 12 | Avalanche predictions | 69.2% | 62 | $33.98 | -4.05% | -28.07% | $12 843 222 527 | |||
| 13 | Lido stETH predictions | 94% | 1 | $2 941.39 | -0.40% | -3.32% | $10 258 752 564 | |||
| 14 | Wrapped Bitcoin predictions | 85.6% | 20 | $62 775.36 | -1.12% | -8.95% | $9 747 006 616 | |||
| 15 | TRON predictions | 87.6% | 15 | $0.110731 | -0.71% | -8.44% | $9 702 951 174 |