


Harmony (ONE): Might Revisit the Historical Low
After the total market meltdown in March, when Harmony (ONE) had been forced brutally to the all-time low at $0.00126, the 186th altcoin had gone on an absolutely splendid bull rally that saw only three brief retracements. Over that period of time, the coin that fuels the sharding and staking blockchain platform got juiced up by 92%, probably causing a lot of traders to buy into FOMO, which then cost them dearly as a jolly bull run was decisively rejected at $0.013, the level that corresponds with the macro resistance and also coincides with the 38.2% Fibonacci retracement line. The rejection has triggered a violent 70% correction with the equally brief periods of retracement that now threatens to completely annihilate all gains from the past six months.
The danger of rolling back to the all-time low
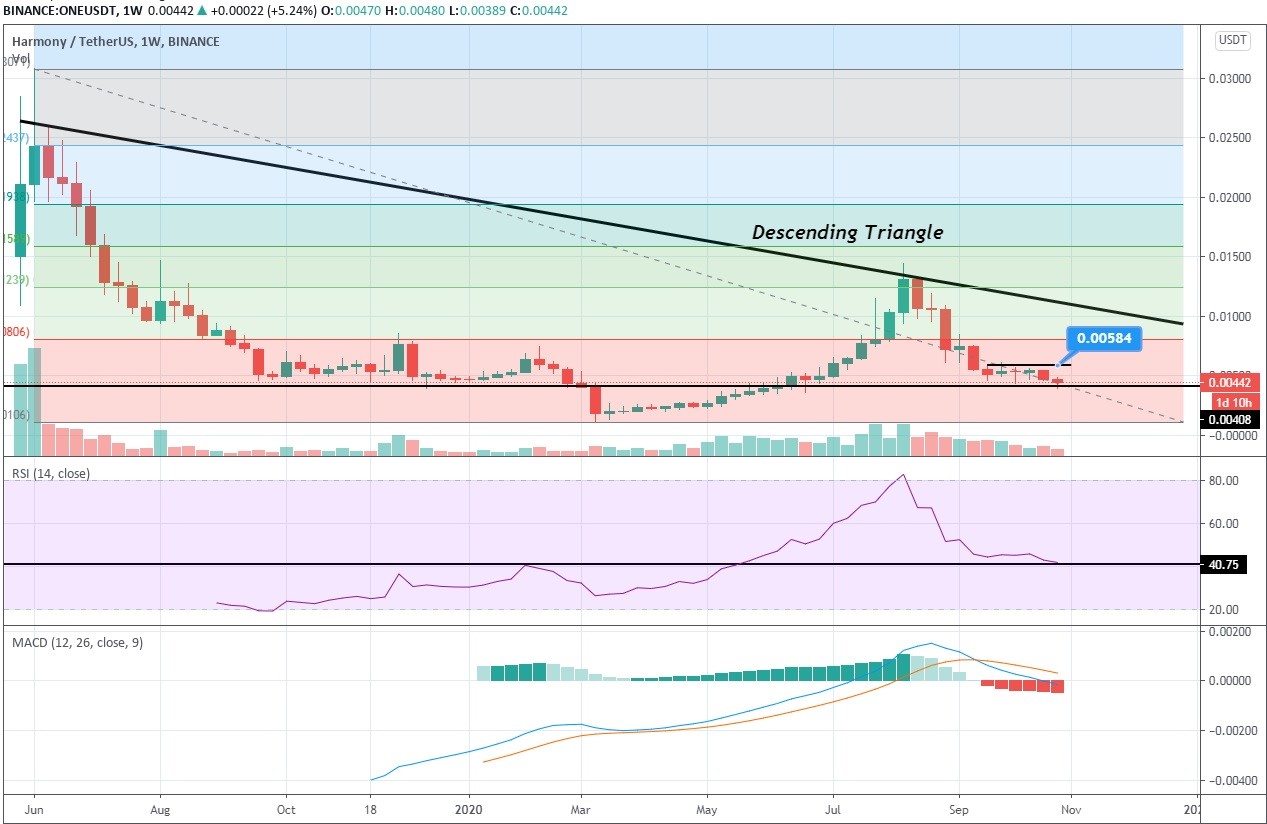
1-week ONE/USDT chart
As of this writing, Harmony's price stands at $0.0043, having receded from $0.0048 at the close of the previous week. It's evident from the weekly chart above that ONE has approached the critical junction that is the support at $0.004 that literally separates the area of active price interaction during the second part of 2019, and the first three months of 2020, and the void with the all-time low at the bottom of it. Obviously, should the bulls fail to keep that support intact, ONE will revisit the historical low, presumably in a few violent swings to the downside since there are no support levels for the buyers to cling onto.
- RSI remains in the neutral zone above 40, with a slight inclination to the downside that suggests the gradual increase of bearish momentum. Traders probably won't see any reversal signals until the oscillator enters the oversold area. By that time, the price is most likely to revisit the all-time low at $0.00126 and might fall even lower;
- The MACD line is already in the bearish control zone with the signal line closing in on zero, where it might get rejected that would translate into a consolidation on the chart.
Besides, it's obvious that ONE is close to resolving a descending triangle pattern, a bearish pattern that usually entails a considerable price drop. There's a possibility, of course, of a bounce to the upside, but it's unlikely to force the price above $0.0058, the top of the current tight range. The best-case bullish scenario here constitutes the 72% spike to $0.007, but that still wouldn't dig Harmony out of the bearish control zone and above the 23.6% Fibonacci retracement level.
Therefore, getting rid of ONE, and cutting losses, before it breaks the support to the downside would be the most practical thing to do since altcoins will continue to suffer from Bitcoin's growing dominance.
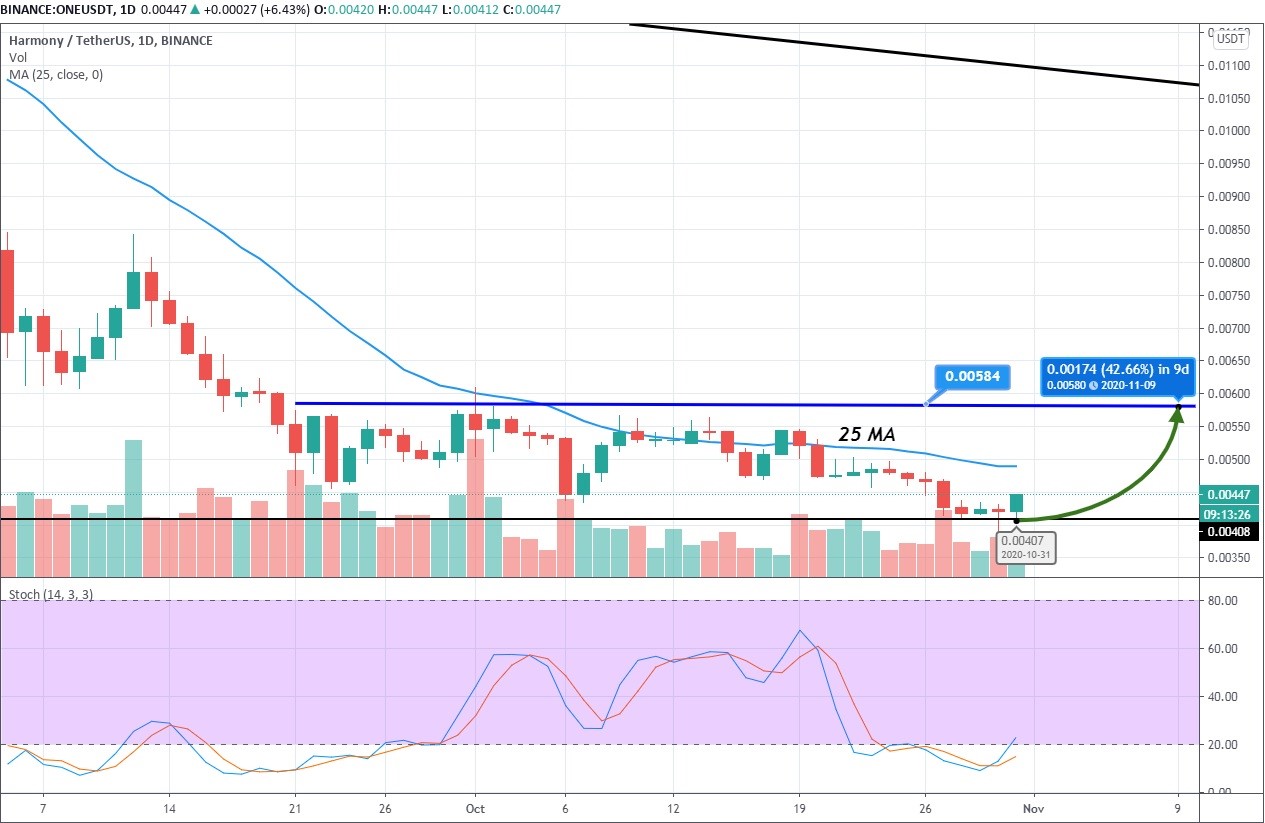
1-day ONE/USDT chart
The daily chart reveals three days of indecision after ONE had touched the support at $0.004, upon which the price started to make way to the upside on the backdrop of rising Stochastic that is now in the oversold zone. This falls in line with our Harmony price prediction regarding a 30% quick bounce to $0.0058, provided that the price would conquer the 25-day MA.
Author: Alex Paulson for Crypto-Rating.com

Top Cryptocurrencies with Price Predictions
| # | Crypto | Prediction | Accuracy | CVIX | Price | 24h | 7d | Market Cap | 7d price change | |
| 1 | Bitcoin predictions | 82% | 23 | $64 742.01 | 0.64% | 1.77% | $1 274 780 684 025 | |||
|---|---|---|---|---|---|---|---|---|---|---|
| 2 | Ethereum predictions | 76.4% | 51 | $3 172.49 | 0.83% | 3.31% | $387 195 965 458 | |||
| 3 | Tether predictions | 94.8% | 1 | $1.000151 | 0.10% | -0.03% | $110 480 177 546 | |||
| 4 | Binance Coin predictions | 88.8% | 19 | $613.50 | 0.94% | 11.20% | $90 545 078 851 | |||
| 5 | Solana predictions | 68% | 71 | $147.24 | -1.60% | 4.31% | $65 823 089 907 | |||
| 6 | USD Coin predictions | 92.8% | 2 | $1.000116 | 0.02% | 0.01% | $33 249 140 497 | |||
| 7 | XRP predictions | 68% | 62 | $0.529314 | -0.40% | 5.30% | $29 180 648 027 | |||
| 8 | Dogecoin predictions | 68% | 60 | $0.153170 | 0.05% | 0.04% | $22 061 749 961 | |||
| 9 | Toncoin predictions | 67.2% | 66 | $5.50 | -2.44% | -15.91% | $19 105 766 327 | |||
| 10 | Cardano predictions | 63.2% | 72 | $0.477005 | -0.38% | 4.34% | $16 997 547 087 | |||
| 11 | SHIBA INU predictions | 62.4% | 82 | $0.000026 | 0.41% | 14.42% | $15 421 640 594 | |||
| 12 | Avalanche predictions | 64% | 68 | $36.13 | -2.09% | 2.94% | $13 663 299 708 | |||
| 13 | TRON predictions | 88% | 21 | $0.117251 | 3.17% | 7.44% | $10 267 623 783 | |||
| 14 | Lido stETH predictions | 90.8% | 1 | $2 941.39 | -0.40% | -3.32% | $10 258 752 564 | |||
| 15 | Wrapped TRON predictions | 85.2% | 19 | $0.117125 | 3.03% | 7.70% | $10 256 553 245 |