


Crypto.com (MCO): Last Obstacle Before the Big Pump
Traders who entered the crypto space in 2017 might remember a payment platform called Monaco that emerged in the market with a simple objective to meliorate online transactions, facilitate the adoption of cryptocurrencies, and assure that the users of their products, which include a proprietary exchange, a mobile application, and physical Visa cards. Later on, the platform was rebranded to Crypto.com, though the native token’s ticker MCO remained unchanged.
Fundamentally, this Singapore-based project enjoys relative success since they claim to have attracted over a million users, although there is no specification with regard to whether this number constitutes daily active users or registered users, which is crucial for assessing the platform’s popularity.
Nevertheless, from the trader’s perspective, MCO is quite an appealing coin because despite being placed outside the top 50 - presently, Crypto.com holds the 63rd spot in global rankings - over the past three months, it has had a fairly large average daily trading volume of around $30 million. But most importantly, MCO’s price action is far from being a dull, flat line on the large time frame.
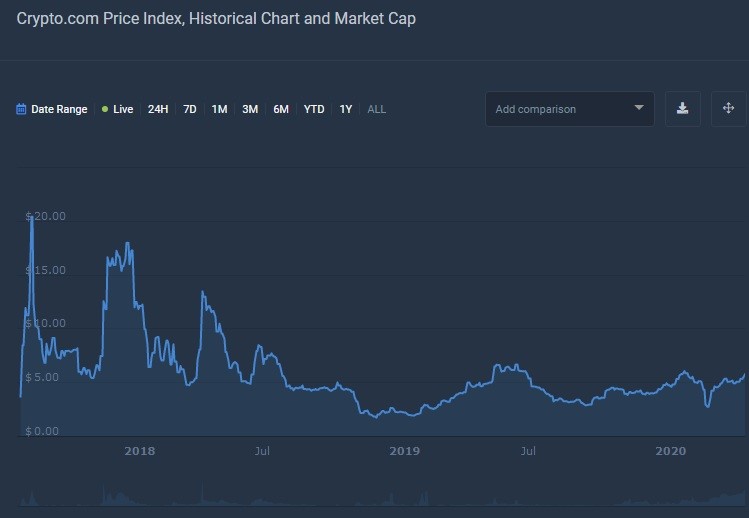
MCO’s all-time price chart
Just by looking at this chart, traders can immediately conclude that Crypto.com is a prime candidate for swing trading because of its numerous price spikes and relatively deep correction, both of which provide enough means for profitable trading.
But if you belong to the class of traders, whose trading style bears similarity with long-term investing, then MCO will also fit right in your alley because it has proven to be a decent gainer on the long distance. While many cryptocurrencies from the same cohort finished the year in the red, Crypto.com increased in value by 17.6% against USD. Judging from the price behavior alone, Crypto.com can be labeled as one of the most appealing mid-ranked altcoins for trading and short-term investment.
The bulls continue to display strength
Probably one of the most distinguishing features of Crypto.com’s price behavior after the coronavirus-induced crash was the pace with which it had recovered after the 58% depreciation. It took MCO less than three weeks to make the trip back above the 200 EMA, as well as the 50 EMA, the crucial trend-determining moving averages, and make up for the losses during that period.
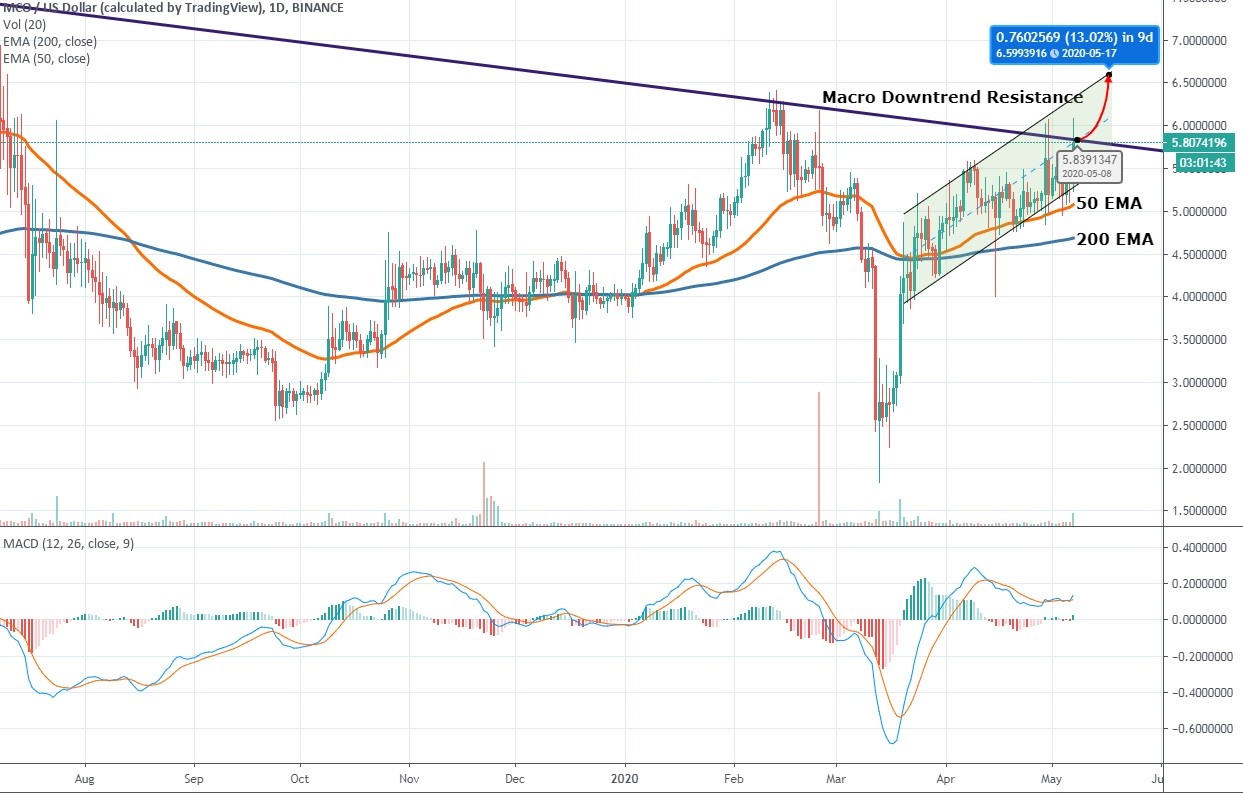
1-day MCO/USDT chart
Note that the faster-moving average didn’t cross the slower one to the downside (a death cross) at any point during this crisis, which shows that the bulls are in the driving seat in this market. This notion is supported by MACD that is flowing between 0 and 20, in the bullish territory. At this particular moment, the MACD line has crossed the signal one to the upside, and a seemingly large tree on a histogram began to emerge, hinting at the commencement of a strong upward swing.
Right now, the 50 EMA serves as a resistance for the price action, with two EMA’s drifting further apart, signifying that the trend is gaining momentum. However, there is one serious obstacle on the MCO’s path - the macro downtrend resistance which the bears will defend vehemently. But the aforementioned factors, along with the fact that the Accumulation/Distribution indicator is on the rise, provide enough reasons to conclude that the trend will persist, and Crypto.com will break the resistance and move towards $6.5.
Author: Alex Paulson for Crypto-Rating.com
Top Cryptocurrencies with Price Predictions
| # | Crypto | Prediction | Accuracy | CVIX | Price | 24h | 7d | Market Cap | 7d price change | |
| 1 | Bitcoin predictions | 78.8% | 31 | $62 739.12 | 2.03% | -10.76% | $1 235 111 352 945 | |||
|---|---|---|---|---|---|---|---|---|---|---|
| 2 | Ethereum predictions | 79.6% | 41 | $3 046.03 | 1.89% | -13.57% | $365 743 745 945 | |||
| 3 | Tether predictions | 92% | 1 | $1.000485 | 0.04% | 0.02% | $109 084 859 564 | |||
| 4 | Binance Coin predictions | 83.6% | 21 | $546.83 | 2.08% | -10.25% | $81 743 047 650 | |||
| 5 | Solana predictions | 73.6% | 48 | $138.61 | 5.08% | -20.01% | $61 933 866 177 | |||
| 6 | USD Coin predictions | 90.4% | 2 | $1.000151 | 0.01% | 0.01% | $33 091 075 053 | |||
| 7 | XRP predictions | 74.4% | 52 | $0.502983 | 1.65% | -17.39% | $27 729 001 886 | |||
| 8 | Toncoin predictions | 71.6% | 61 | $6.53 | 8.23% | -8.85% | $22 682 803 053 | |||
| 9 | Dogecoin predictions | 68.4% | 60 | $0.149542 | 2.00% | -23.53% | $21 525 310 894 | |||
| 10 | Cardano predictions | 69.6% | 56 | $0.454844 | 2.56% | -22.62% | $16 202 750 617 | |||
| 11 | SHIBA INU predictions | 60% | 85 | $0.000022 | 1.76% | -18.85% | $13 218 649 704 | |||
| 12 | Avalanche predictions | 71.6% | 63 | $34.49 | 3.17% | -25.57% | $13 035 378 083 | |||
| 13 | Lido stETH predictions | 92.4% | 1 | $2 941.39 | -0.40% | -3.32% | $10 258 752 564 | |||
| 14 | Wrapped Bitcoin predictions | 78.8% | 31 | $63 055.22 | 2.86% | -10.29% | $9 797 755 685 | |||
| 15 | Polkadot predictions | 73.6% | 52 | $6.73 | 2.47% | -20.32% | $9 652 588 443 |