


Chainlink (LINK) Price Prediction for 2020
After a marvelous performance of Chainlink in 2019, during which the coin boasted inspiring gains that amounted to more than 400%, traders are asking themselves, what’s next in store for LINK? Would it continue the victorious march to the upside and eventually surpass the current all-time high of $4.51, or would the coin take time off from intense action and trade sideways for some time?
But before getting down to analyzing the ongoing price action of LINK and trying to predict its behavior in the foreseeable future, let’s appreciate one last time the more than respectful gains which this coin had showcased in 2019.

Such an astonishing success was instigated by the substantial improvements in fundamentals, thanks to the efforts made by the team during the previous year. The most notable event, of course, was the launch of the mainnet on the Ethereum network on May 30.

It clearly had a major positive effect on the price of LINK that had literally exploded to its record levels in little less than a month, having hit the aforementioned all-time high on June 29. Obviously, traders shouldn’t expect similar trips to the Moon in 2020, though there are rumors swirling around regarding Chainlink’s potential partnership with Advanced Micro Devices (AMD), an American corporation that is arguably the biggest player on the market of computer microprocessors. There is no official confirmation of this deal as of yet, but should it occur, LINK would once again become the talk of the town. But for now, let’s concentrate on the ongoing action on the charts and see whether Chainlink is gearing up for the next bull rally, or would the correction persist?
A good start of the year for LINK
After a strong bounce from the support level at $1.5 in the last week of September 2019, and a relatively long consolidation period, LINK had briefly broken through the $3 resistance and then began a correction that lasted up until January 5.
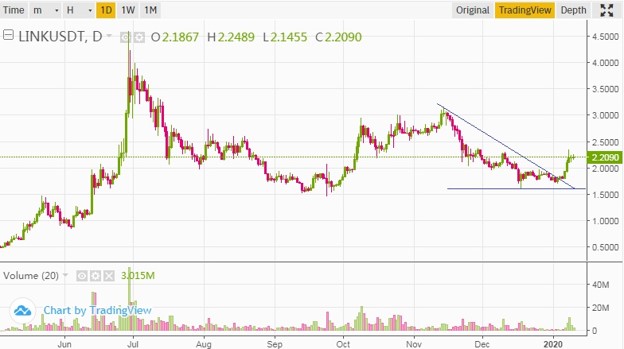
While being in the correction, Chainlink was moving almost perfectly within the descending triangle, as seen in the chart above. On January 4 and 5, LINK has broken through this triangle to the upside and began forming what appears to be a bullish flag pattern. But in order for this pattern to be confirmed, the coin has to trade sideways for the next few days.
The question now is, would the price then break through the flag to the upside or the downside? There is one sign that points to the inception of another bull rally on the part of LINK, which is a bullish divergence on the RSI oscillator.
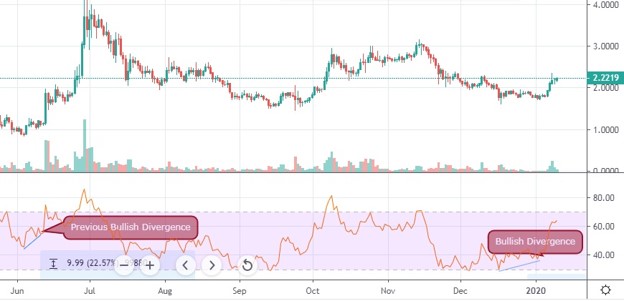
Chainlink seems to abide by this signal, as there have been two such divergences in 2019, one of them in the period between September and October of 2019 isn’t marked on the chart, and another one preceding its biggest rally so far. Should the upward move happen, it is likely to take the price to the next Fibonacci level, which stands at $2.66 that should serve as resistance for the time being.
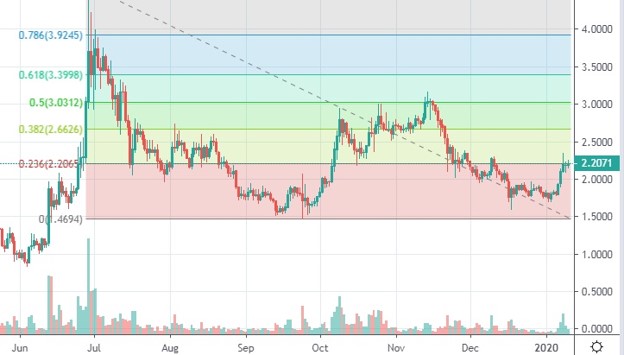
That move should happen over the course of the next week. In the longer perspective, LINK should be trading within the confines of the price corridor marked on the chart below.
The area around $3 should prove to be a very strong resistance - in order to break through it, LINK would have to accumulate strength at the said Fibo level. Nevertheless, nearly all technical indicators are bullish on this coin, so going long might be an option here.
Author: Alex Paulson for Crypto-Rating.com


Top Cryptocurrencies with Price Predictions
| # | Crypto | Prediction | Accuracy | CVIX | Price | 24h | 7d | Market Cap | 7d price change | |
| 1 | Bitcoin predictions | 82% | 27 | $66 152.75 | 0.02% | 5.93% | $1 302 514 697 346 | |||
|---|---|---|---|---|---|---|---|---|---|---|
| 2 | Ethereum predictions | 71.6% | 49 | $3 260.54 | 2.33% | 7.26% | $397 939 741 032 | |||
| 3 | Tether predictions | 92.4% | 1 | $1.000091 | -0.01% | -0.03% | $110 473 610 456 | |||
| 4 | Binance Coin predictions | 84.4% | 18 | $608.60 | 0.45% | 13.41% | $89 821 881 944 | |||
| 5 | Solana predictions | 66.4% | 67 | $157.84 | 1.92% | 18.64% | $70 560 605 911 | |||
| 6 | USD Coin predictions | 91.6% | 2 | $1.000071 | 0.03% | 0.02% | $33 676 117 408 | |||
| 7 | XRP predictions | 66.8% | 61 | $0.540405 | -0.82% | 10.45% | $29 792 088 761 | |||
| 8 | Dogecoin predictions | 73.2% | 57 | $0.160814 | 1.38% | 5.15% | $23 159 807 120 | |||
| 9 | Toncoin predictions | 68% | 66 | $5.72 | 0.91% | -7.75% | $19 870 855 798 | |||
| 10 | Cardano predictions | 68.4% | 63 | $0.495442 | -3.47% | 10.99% | $17 654 551 521 | |||
| 11 | SHIBA INU predictions | 59.6% | 82 | $0.000027 | 2.11% | 23.38% | $15 949 968 795 | |||
| 12 | Avalanche predictions | 67.2% | 63 | $38.64 | 0.69% | 14.45% | $14 606 810 655 | |||
| 13 | Polkadot predictions | 70.8% | 58 | $7.34 | -0.65% | 12.09% | $10 541 784 549 | |||
| 14 | Wrapped Bitcoin predictions | 82% | 24 | $66 384.66 | 0.36% | 6.30% | $10 315 096 097 | |||
| 15 | Lido stETH predictions | 95.6% | 1 | $2 941.39 | -0.40% | -3.32% | $10 258 752 564 |