


Bitcoin Cash (BCH): Another Rally Ends in Shatters
It seems that Bitcoin Cash (BCH) has established a steady pattern that can be labeled as a horseshoe. It implies that a significant bull rally always ends with the price going back to the point of its origin, leaving those who were panic buying when the price was soaring with a huge bag of devalued coins.
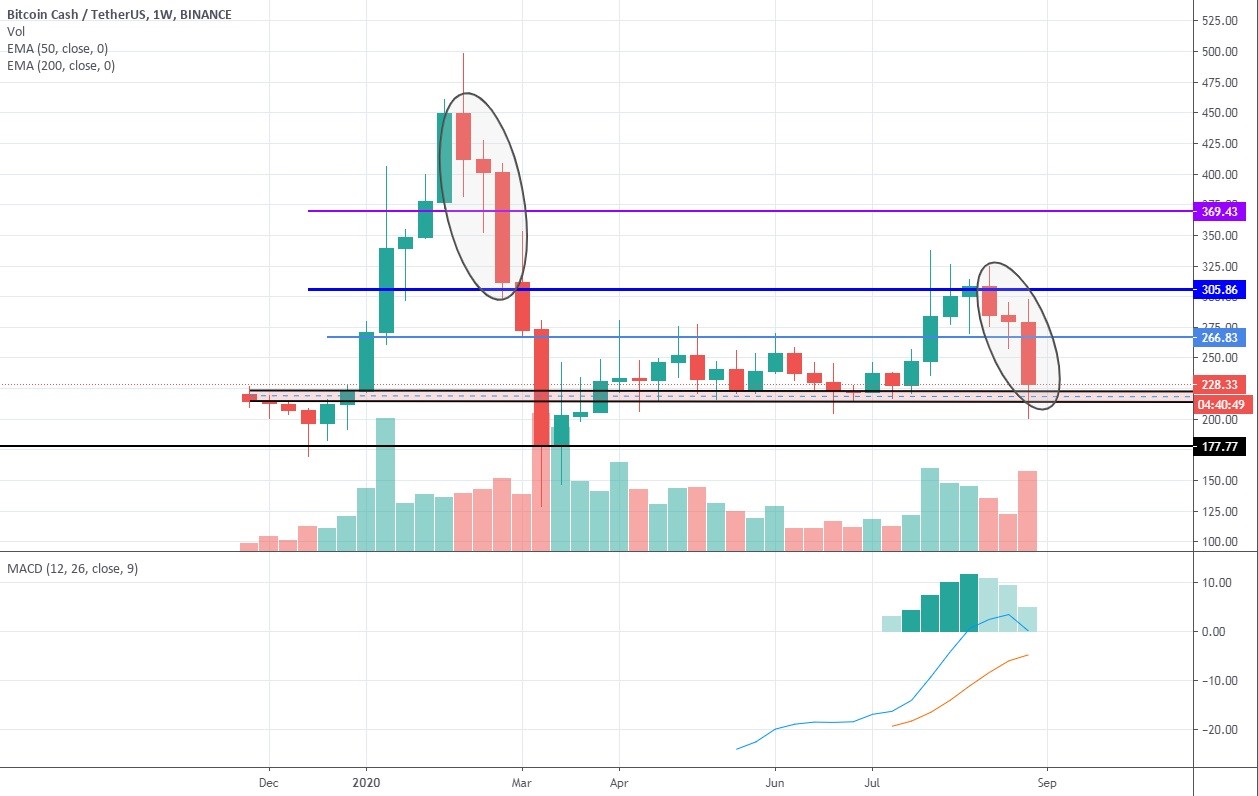
1-week BCH/USDT chart
That is precisely what happened at the beginning of the year, when BCH had exploded to the upside and made 200% in eight weeks, which doesn’t seem that impressive in hindsight, considering the astronomical gains made by some DeFi coins over the summer. BCH peaked at $500 and then collapsed all the way to $130 in March.
It’s sink or float aimlessly for Bitcoin Cash now
Over the past two months, we have seen the same scenario developing, only on a much smaller scale. This time around, the bulls didn’t have enough puff to push the fork of Bitcoin higher than $340, the level where the bears have stepped in and started pressurizing BCH down in a pattern that is remarkably similar to the one that emerged during the winter correction: the initial push, followed by a week of indecision, and finalized by a nosedive.
The price action has already drawn a horseshoe, effectively wiping out all gains made in the last month, and once again found support in the area between $215 and $225. Now, the question is whether Bitcoin Cash would grab hold of that level and enter a consolidation phase with some bullish outlook, or would it slide even lower and find itself near $180, thus making a return trip to the depth seen during the March crisis.
A sudden initiation of a bull rally is obviously not an option here, simply because the demand for Bitcoin Cash has been quite insignificant for a top-ranked cryptocurrency in the post-crash period, and it’s unlikely to change any time soon. This leaves BCH either with a consolidation or a deeper pullback on the menu. This assumption is confirmed by MACD, which shows the intensification of bearish momentum after being rejected at the zero line.
Therefore, if the latest dump across the entire crypto market turns out to be a substantiated market move and not a fluke, Bitcoin Cash is highly likely to cross the designated borderline and enter the bearish territory where it could stay for the remainder of the year.
The situation on the daily time frame demonstrates that BCH had already made a decisive step into the bearish area since the price has fallen below both 50 EMA and the trend-setting 200 EMA, and now the two moving averages begin to form a potential death cross, although that particular pattern has proven to be very tricky when applied to the crypto market.

1-day BCH/USDT chart
Here MACD is even deeper in the bears’ territory, with its lines showing that the bearish momentum persists. The buyers are holding to $215 for dear life, and if they manage to keep BCH from sinking until MACD starts showing signs of a bullish reversal, traders are likely to witness the commencement of consolidation above the current support. Otherwise, the move southward below $200 would be almost inevitable.
Author: Alex Paulson for Crypto-Rating.com


Top Cryptocurrencies with Price Predictions
| # | Crypto | Prediction | Accuracy | CVIX | Price | 24h | 7d | Market Cap | 7d price change | |
| 1 | Bitcoin predictions | 82.4% | 26 | $61 292.24 | -4.32% | -12.43% | $1 206 564 917 346 | |||
|---|---|---|---|---|---|---|---|---|---|---|
| 2 | Ethereum predictions | 83.2% | 32 | $2 999.19 | -3.38% | -14.63% | $360 117 900 419 | |||
| 3 | Tether predictions | 92% | 1 | $0.999859 | -0.06% | -0.02% | $108 717 143 672 | |||
| 4 | Binance Coin predictions | 89.2% | 18 | $536.78 | -1.12% | -11.50% | $80 258 760 835 | |||
| 5 | Solana predictions | 79.6% | 42 | $135.11 | -1.71% | -21.72% | $60 355 987 465 | |||
| 6 | USD Coin predictions | 95.6% | 2 | $0.999875 | -0.02% | -0.02% | $32 512 251 853 | |||
| 7 | XRP predictions | 81.2% | 37 | $0.495590 | -0.23% | -19.61% | $27 316 850 911 | |||
| 8 | Dogecoin predictions | 72.4% | 57 | $0.148549 | -5.60% | -25.78% | $21 380 062 673 | |||
| 9 | Toncoin predictions | 73.2% | 51 | $6.15 | -0.85% | -8.47% | $21 346 888 535 | |||
| 10 | Cardano predictions | 76.8% | 45 | $0.448920 | -2.63% | -22.82% | $15 989 890 543 | |||
| 11 | SHIBA INU predictions | 62% | 85 | $0.000022 | -2.70% | -20.72% | $13 056 286 082 | |||
| 12 | Avalanche predictions | 68% | 65 | $34.13 | -2.52% | -27.97% | $12 899 169 697 | |||
| 13 | Lido stETH predictions | 93.2% | 1 | $2 941.39 | -0.40% | -3.32% | $10 258 752 564 | |||
| 14 | Wrapped TRON predictions | 90% | 13 | $0.110175 | -0.97% | -7.25% | $9 653 480 964 | |||
| 15 | TRON predictions | 90.8% | 12 | $0.110102 | -1.42% | -7.18% | $9 647 092 238 |