


Bitcoin (BTC): Are We Looking At Another Bart Simpson Pattern?
We are now able to state with certainty that the intoxicating hype around the halving event had died off completely, and now the market is suffering through a bad hangover that results in almost total stagnation of price action. The psychological level at $10,000 has once again remained unbroken, and now Bitcoin is plodding strenuously to the downside.
Before the halving, we have seen literally hundreds of BTC price predictions and schematic charts that depicted the further direction of the price, most of them being exceedingly bullish in the long run. The fact that Bitcoin will eventually reach and surpass the all-time high is almost certain, but at this particular juncture, things aren't looking bullish at all.
Is Bart Simpson here to play a dirty trick on Bitcoin?
In a nutshell, the Bart Simpson pattern occurs when after a period of significant growth, like we have seen on the part of BTC after the COVID-19 market crash, the price stumbles upon a rock-hard resistance ($10,000), get choppy and start ranging with the inclination to the downside. As you could have probably guessed, this pattern is visually reminiscent of the spiky haircut of the mischief-maker from the famous cartoon series.

Example of the Bart Simpson pattern
Now, please take a look at the daily BTC/USDT chart that bears a clear resemblance to the pattern above. While it is not a textbook formation per se, over the time, Bart Simpson has proven itself as a reliable bearish signal if confirmed by the corresponding indicators.
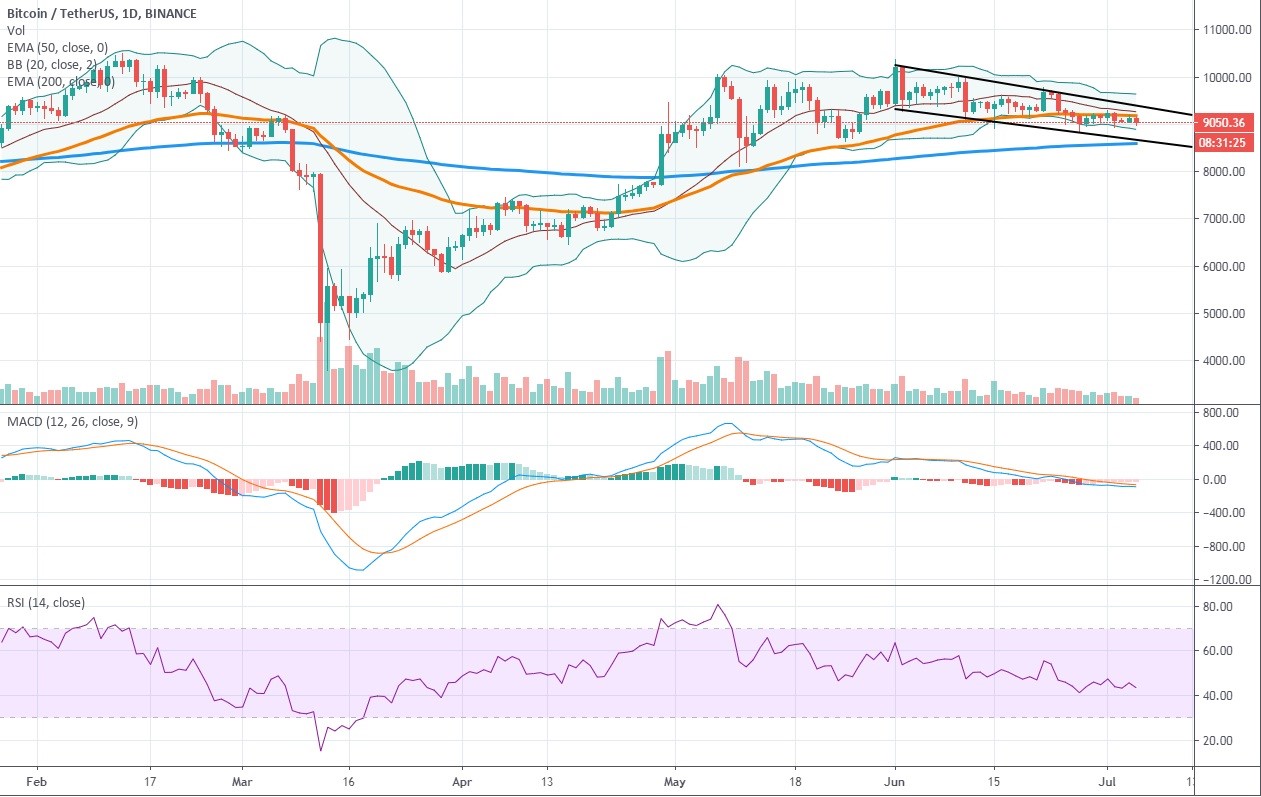
Daily BTC/USDT chart
- MACD has been visibly bearish even since Bitcoin tested $10,000 for the first time since the crash. The indicator has already traveled beneath zero, which tells traders that the bears have seized the initiative. There are no signs of approaching dump yet, but the overall outlook is getting bearish by the day;
- RSI is largely mimicking the behavior of MACD, as it also began to slide in the direction of the oversold zone right after the halving. Also, the bearish divergence, which we have highlighted in one of the previous Bitcoin price prediction articles, seems to be playing out correctly.
- Bollinger Bands don't show any signs of a squeeze that could lead to the volatility spike, although the price action has moved beneath the middle line, which is usually a sign of bears taking control over the market;
- For the first time since April 23, the BTC price has fallen below the 50-period EMA that could also be interpreted as a signal to sell. A drop below the 200 EMA would mean the amplification of the bearish outlook and the probable emergence of the inverted cup and handle pattern.
On top of that, we see that the price is already squeezing into the descending channel that begins to dissolve the uptrend structure. The sharp drop of mentions of Bitcoin in social media, Twitter, in particular, shows that retail investors have lost interest in the first cryptocurrency, and traders mustn't rely upon the influx of money into this market any time soon.

BTC tweets chart
As expected, there has also been an enormous drop in mining profitability post halving that still keeps on sliding down, which could force miners to sell the previously obtained coins.

BTC mining profitability chart
To summarize, we reckon that the price of Bitcoin is bound to drop to $8500 - $8600, and the further course of price action would depend on whether the buyers would be able to keep the price above the 200 EMA.
Author: Alex Paulson for Crypto-Rating.com

Top Cryptocurrencies with Price Predictions
| # | Crypto | Prediction | Accuracy | CVIX | Price | 24h | 7d | Market Cap | 7d price change | |
| 1 | Bitcoin predictions | 82.8% | 23 | $64 632.88 | 0.65% | 2.43% | $1 272 627 811 897 | |||
|---|---|---|---|---|---|---|---|---|---|---|
| 2 | Ethereum predictions | 70.8% | 51 | $3 167.32 | 1.09% | 3.74% | $386 565 012 053 | |||
| 3 | Tether predictions | 95.6% | 1 | $0.999505 | 0.02% | -0.09% | $110 408 795 669 | |||
| 4 | Binance Coin predictions | 88.8% | 20 | $616.14 | 3.20% | 12.34% | $90 935 347 112 | |||
| 5 | Solana predictions | 67.2% | 71 | $147.76 | -0.81% | 6.46% | $66 055 257 877 | |||
| 6 | USD Coin predictions | 95.2% | 2 | $0.999838 | 0% | -0.02% | $33 235 786 809 | |||
| 7 | XRP predictions | 66.4% | 62 | $0.530438 | -0.70% | 6.02% | $29 242 586 591 | |||
| 8 | Dogecoin predictions | 68.4% | 60 | $0.152354 | -0.65% | 1.86% | $21 943 932 939 | |||
| 9 | Toncoin predictions | 68.8% | 66 | $5.49 | -2.27% | -13.40% | $19 050 349 764 | |||
| 10 | Cardano predictions | 62.4% | 72 | $0.473799 | -0.61% | 5.08% | $16 883 306 479 | |||
| 11 | SHIBA INU predictions | 58.8% | 82 | $0.000026 | 0.44% | 14.93% | $15 299 695 761 | |||
| 12 | Avalanche predictions | 66.8% | 68 | $35.87 | -2.56% | 3.71% | $13 561 212 009 | |||
| 13 | Lido stETH predictions | 96% | 1 | $2 941.39 | -0.40% | -3.32% | $10 258 752 564 | |||
| 14 | TRON predictions | 86% | 21 | $0.117057 | 3.17% | 7.61% | $10 250 734 497 | |||
| 15 | Wrapped TRON predictions | 84.4% | 19 | $0.116624 | 2.62% | 7.41% | $10 212 821 974 |