


Band Protocol (BAND): A Bounce or a Deeper Correction
Band Protocol (BAND), the token that serves the blockchain network for data oracles, has had an absolutely stunning performance this year as its yearly gains against USD stand at 1,113%, even though the market is in the state of deep correction.
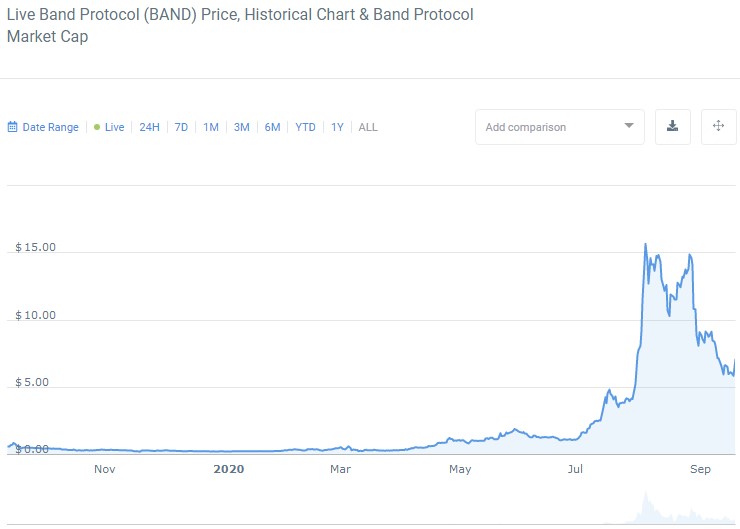
BAND historical chart
The DeFi token also did well against Bitcoin - a 956% gain since the beginning of the year, and Ethereum - a 560% advantage over the second cryptocurrency. Last month, however, was colored red for BAND as it lost more than 30% across the board due to the ongoing correction that became a logical conclusion to the parabolic rise that ran its course when the price made a new all-time high at $17.48. BAND has rolled back by 60% since the ATH that fell in line with the developments on the cryptocurrency market and the quieting of the DeFi frenzy.
On the brink of the bullish bounce
Band Protocol is currently priced at $7.09 on the backdrop of the 12% gain in the last 24 hours. The market capitalization of the 73rd currency also suffered a significant decrease because of the correction and fell from $344 million to the present $145 million, while the average daily trading volume in the last 30 days fluctuated between $110 million and $330 million, though, at the beginning of July, it was barely exceeding $10 million. It comes to show that the demand for BAND remains high despite the losses, and traders are using the protracted bearish pause to accumulate more tokens before the presumed second phase of the uptrend commences. But the current situation on the macro level dictates that the participants might not see another episode of explosive bullish action for the next two to three months because of the traditional fragility of the cryptocurrency market in autumn.
The situation on the weekly time frame sees the price making the last effort to resolve the big bullish flag pattern to the upside, which might happen if BAND bounces off the middle line of Bollinger Bands in the direction of $12, while the signal line of MACD denies the bearish crossover.
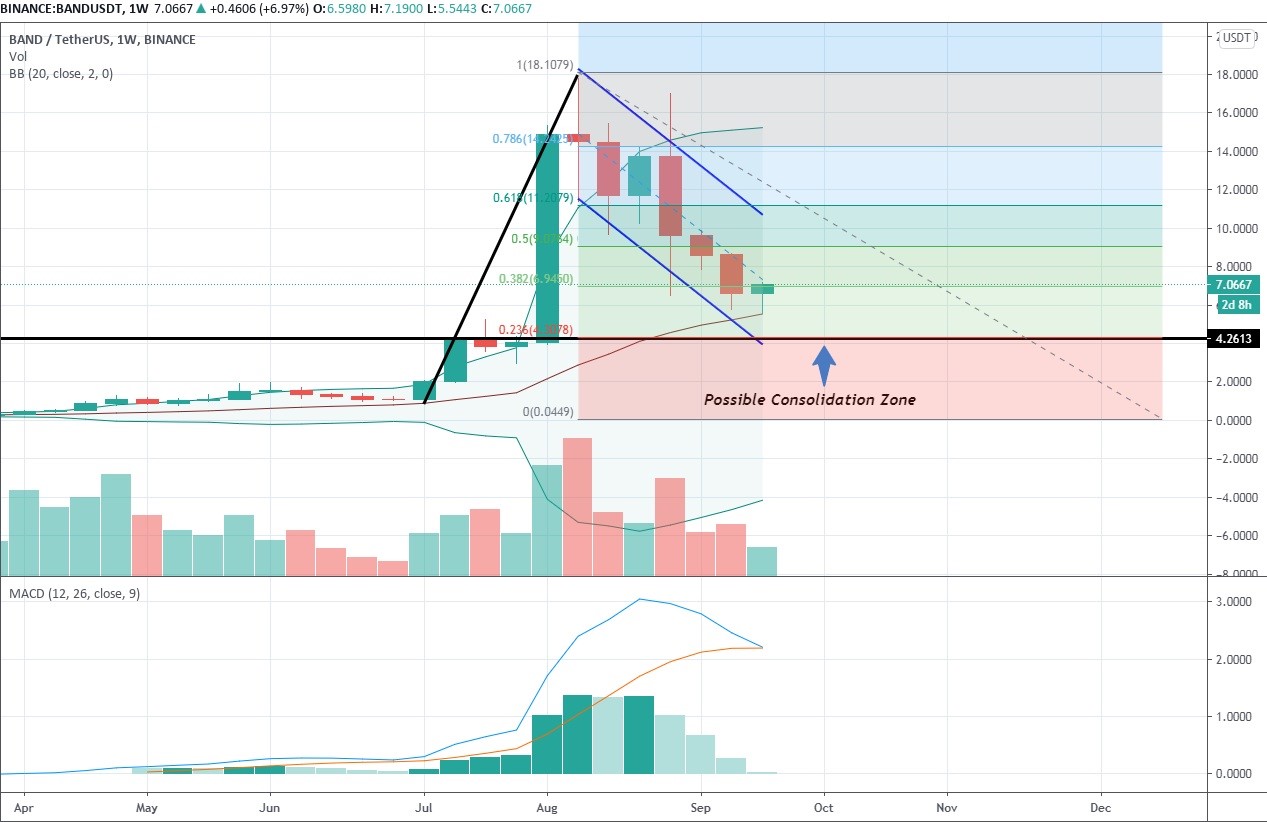
1-week BAND/USDT chart
The bullish scenario would be viable only if this week’s candle closes above the middle line of BB. Should the price drop to the support line at $4.2, the immediate resolution to the upside would be almost impossible. In that case, we could see the consolidation around the psychological zone at $4 that converges perfectly with the 23.6% Fibonacci retracement level that adds some extra support capabilities. If that level gets broken to the downside, the trip below $2 would appear almost inevitable, especially if MACD would go for a bearish crossover.
The daily time frame shows that the buyers are beginning to push back as the current daily candle has risen above the close of all candles in the potential reverse area, depicted on the chart below.
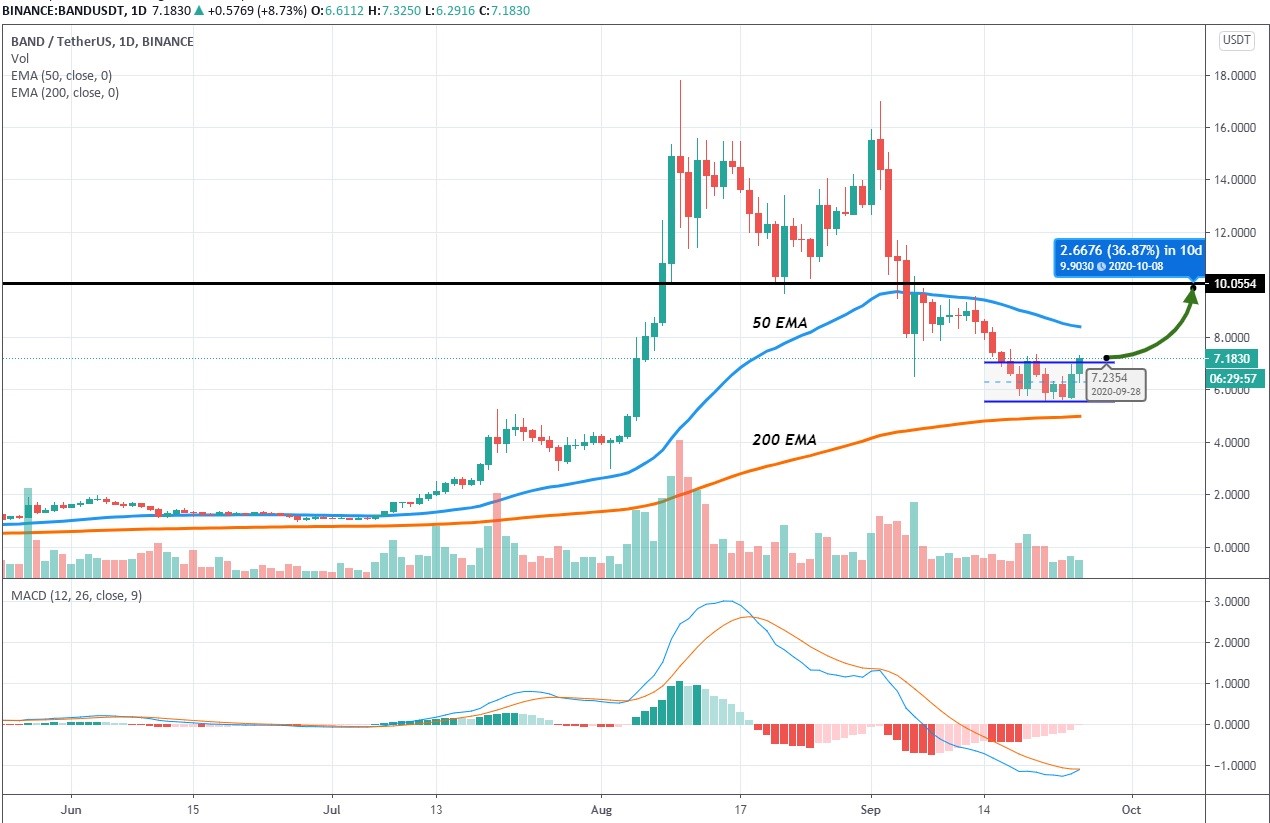
1-day BAND/USDT chart
If the week of price action closes above that area, we could see a bounce to $10 that would bring the price back above the 50 EMA. The possibility of the upside recovery is further increased by the bullish crossover that is about to occur on MACD. In doing so, the price will remain above the 200 EMA, thus increasing the probability of uptrend restoration.
Author: Alex Paulson for Crypto-Rating.com


Top Cryptocurrencies with Price Predictions
| # | Crypto | Prediction | Accuracy | CVIX | Price | 24h | 7d | Market Cap | 7d price change | |
| 1 | Bitcoin predictions | 79.6% | 29 | $62 432.37 | 1.28% | -12.22% | $1 229 088 850 752 | |||
|---|---|---|---|---|---|---|---|---|---|---|
| 2 | Ethereum predictions | 74.4% | 42 | $3 003.22 | -0.35% | -15.42% | $360 606 334 867 | |||
| 3 | Tether predictions | 91.2% | 1 | $1.000369 | 0.03% | 0.02% | $109 509 952 703 | |||
| 4 | Binance Coin predictions | 84.4% | 22 | $545.34 | -0.88% | -11.76% | $81 520 278 622 | |||
| 5 | Solana predictions | 72.4% | 49 | $139.37 | 3.67% | -20.17% | $62 274 393 690 | |||
| 6 | USD Coin predictions | 95.2% | 2 | $1.000172 | 0.01% | 0.01% | $33 063 352 480 | |||
| 7 | XRP predictions | 71.6% | 52 | $0.489587 | -1.41% | -20.20% | $26 990 528 211 | |||
| 8 | Toncoin predictions | 69.6% | 61 | $6.80 | 12.24% | -5.86% | $23 592 349 675 | |||
| 9 | Dogecoin predictions | 68.4% | 60 | $0.148709 | 0.22% | -25.63% | $21 405 852 173 | |||
| 10 | Cardano predictions | 68.8% | 57 | $0.447145 | -0.59% | -24.37% | $15 929 413 966 | |||
| 11 | SHIBA INU predictions | 57.2% | 85 | $0.000022 | -0.31% | -20.68% | $13 008 195 607 | |||
| 12 | Avalanche predictions | 67.6% | 63 | $34.06 | -0.60% | -27.28% | $12 873 261 969 | |||
| 13 | Lido stETH predictions | 95.2% | 1 | $2 941.39 | -0.40% | -3.32% | $10 258 752 564 | |||
| 14 | Wrapped Bitcoin predictions | 78.8% | 32 | $62 443.65 | 1.19% | -12.10% | $9 702 728 212 | |||
| 15 | Polkadot predictions | 72% | 52 | $6.57 | -1.22% | -22.45% | $9 432 840 252 |